CSC/ECE 517 Spring 2024 - E2434 Reimplement Frontend for the Grades view
Expertiza
Expertiza is an open-source learning management system built with Ruby on Rails as its core. Its features include creating tests and assignments, managing assignment teams and courses, and above all having a solid framework in place to facilitate peer reviews and group comments. The main objective of this project is to develop frontend React Components, with a particular focus on the Grades View page. The goal is to create a fully functional user interface for these components using React.js and TypeScript.
Introduction
The main objective of this project is to reimplement the front end for the grades view page within Expertiza.
Problem Statement
The following tasks were required for the reimplementation :
- Frontend Reimplementation: Reimplement the frontend of the grades view page in React.js and Typescript which is currently in Ruby.
- Removal of Checkboxes for Word Count: Remove checkboxes related to word count criteria (>10 words, >20 words).
- Include Toggle Question: Include checkbox to show question text in the column in Heat Map.
- Enhanced "Show Submission" Button: The Show Button should reveal the submitted links and the submitted files.
- List Review: List all the reviews present and give toggle button to show/hide the reviews
- Author Feedback: List all the author feedback present and give toggle button to show/hide the reviews
- Removal of Unused Elements: Remove any unused elements such as URLs, color legends, etc., to streamline the interface. If any column isn’t present, entire columns shouldn’t show up like teammate review
- Include Heat Map: Heat map should be included in the grades view page.
- Improve UI: Our aim is to improve user experience and interface efficiency by developing a refreshed front end using React and TypeScript.
- Include Statistical data: The page should have stats related to the received reviews and author feedback
Design Patterns and Principles
DRY Principle:
We demonstrated adherence to the DRY Principle by reducing redundancy in our React application. Utilizing pre-existing components and functionalities such as React's open function and Show Reviews component, we avoided duplicating code for similar functionalities across our application. This commitment to the DRY Principle enhanced code maintainability, readability, and scalability while minimizing the risk of introducing bugs or inconsistencies due to repeated code segments.
Composite Design Pattern:
We effectively designed our Grades View component by utilizing the Composite Design Pattern, nesting and composing elements like Table and Modal. This pattern facilitated the creation of a hierarchical structure, allowing us to treat individual elements and compositions uniformly. By leveraging this pattern, we achieved flexibility and scalability in our UI design without compromising the overall structure of the component.
Provider Pattern:
Our goal was to apply the Provider Pattern to React's Context API, enabling data or functionalities to propagate naturally throughout the component hierarchy without requiring explicit prop drilling. By creating a Provider component at the root level of our application, we centralized state management and reduced coupling between components. This approach improved code maintainability and readability while promoting cleaner code by eliminating the need for manual prop passing through multiple levels of components.
Observer Pattern:
Leveraging hooks like useEffect and useState along with React's Context API, we effectively utilized the Observer Pattern to manage component state and side effects efficiently. By subscribing to changes in state, we were able to trigger re-renders accordingly, promoting a reactive programming paradigm. This approach facilitated modularization and testing of our code, enhancing overall maintainability and readability.
HOC Pattern:
Routing for new pages became more efficient as we employed the Higher-Order Component pattern, or HOC Pattern. This involved creating functions that took an input component and returned a modified version with routing functionality. By encapsulating routing logic within HOCs, we promoted code reusability and separation of concerns. This approach allowed us to apply common functionalities across multiple components without duplicating code, enhancing code maintainability and scalability.
Mediator Pattern:
Our goal was to apply the Mediator Pattern to manage communication between different components or systems in our application. We utilized a mediator component or service to centralize control logic and reconcile discrepancies between frontend requirements and backend data structures. By translating and adapting data as needed, we ensured consistency and compatibility across the application. This approach promoted a loosely coupled architecture, where components interacted through a centralized mediator, enhancing flexibility and maintainability.
Design
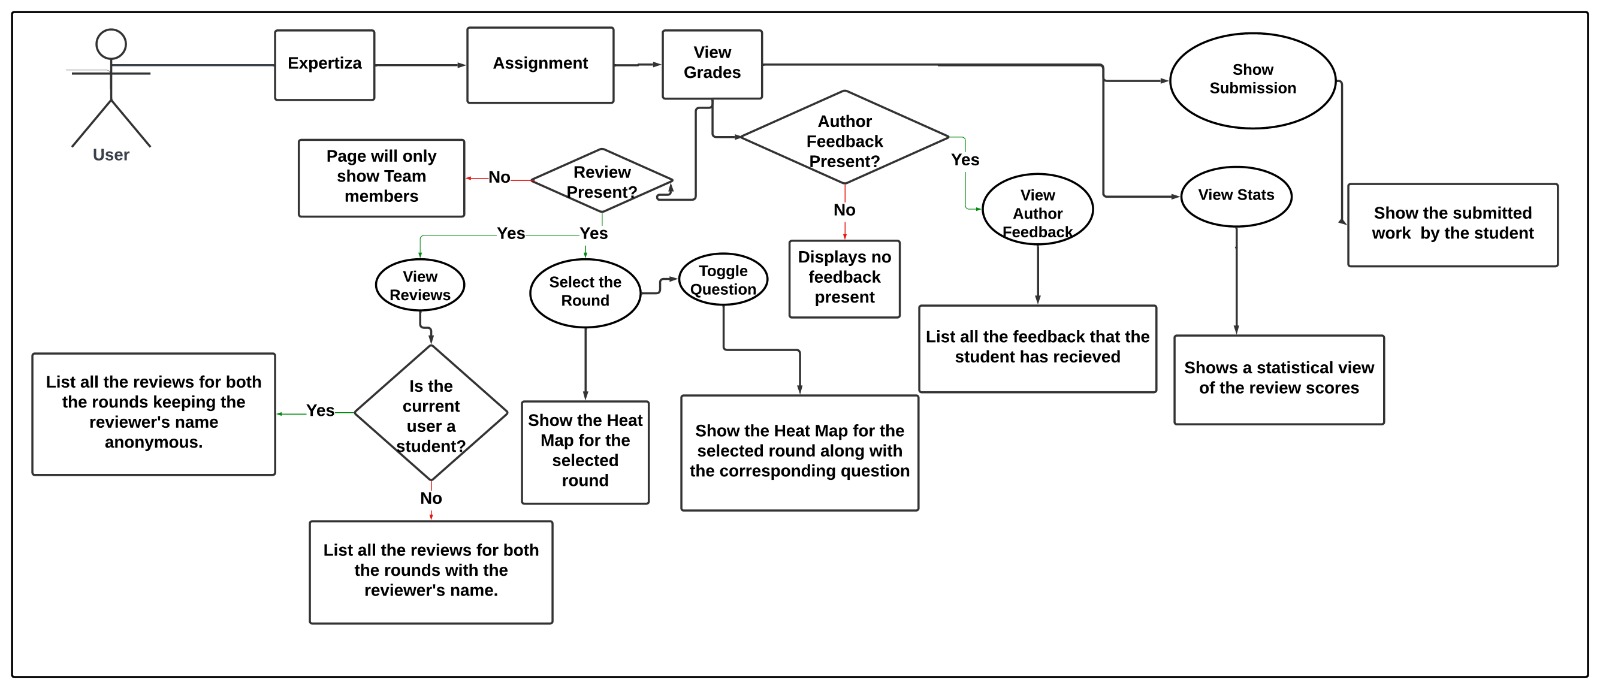
The designs provided are for the existing Grades View Page, which has already been implemented. Our goal is to replicate these designs for the new components mentioned earlier in the project. This involves creating similar visual elements, layouts, and functionalities for these new components to maintain consistency and coherence across the application.
Existing Grades View Page
Flow Chart for the New Grades View Page
Implementation
Modified Heat Map
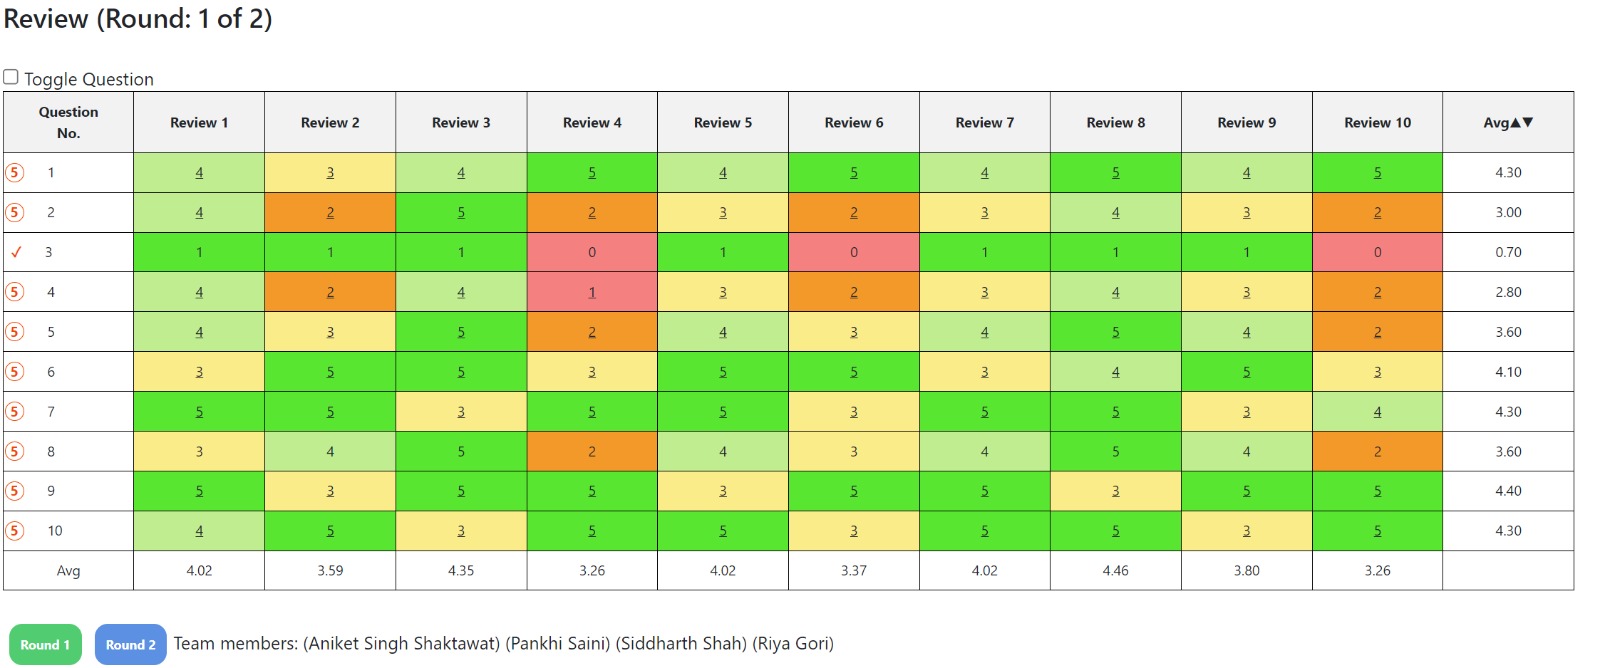
Modified Heat Map to show score for every question per review along with the average score in each review and average score per question. Following is the screenshot of the Heat Map.
Added Show Reviews Functionality
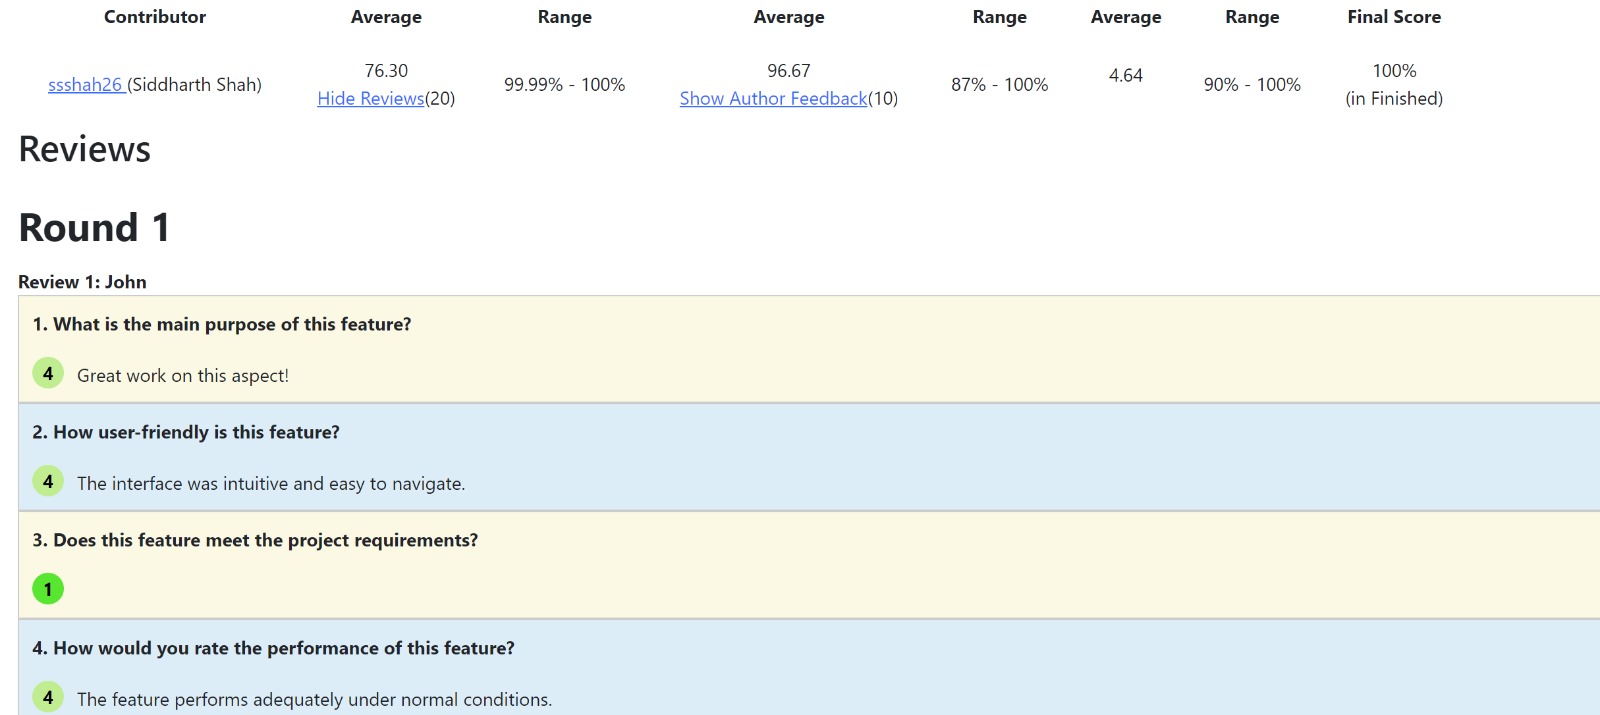
Created seamless UI to show the reviews and their scores.The colour of the score is different for each individual value. If the role of the user logged in is student then the name of the reviewer will not be shown and rest every other role will be able to see the name in front of every review. Following is the screenshot of the functionality mentioned above. We added dummy data for reviews in the heatMapData.json, and iterated through this dummy data to show each review for every question in each round. The following is the code snippet for achieving this functionality.
Added Author Feedback
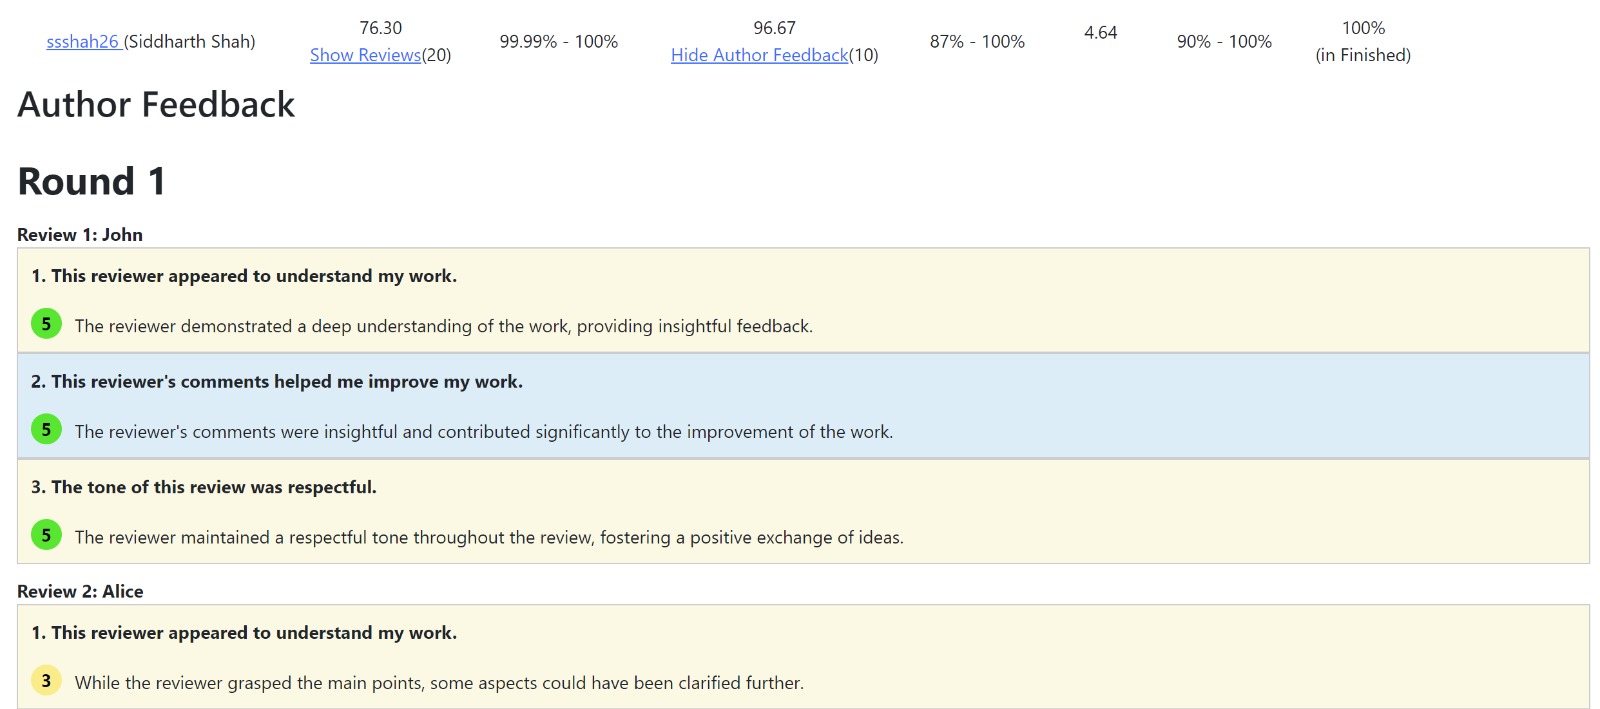
We added functionality to show author feedback similar to the show reviews. We added the dummy data in the authoerFeedback.json file to show the author feedback in the same format as the reviews were shown. We followed DRY principle to replicate the components of the UI of the reviews to the Author Feedback and also used the same classes to add the css to the author feedback.
Added Toggle Question List Button
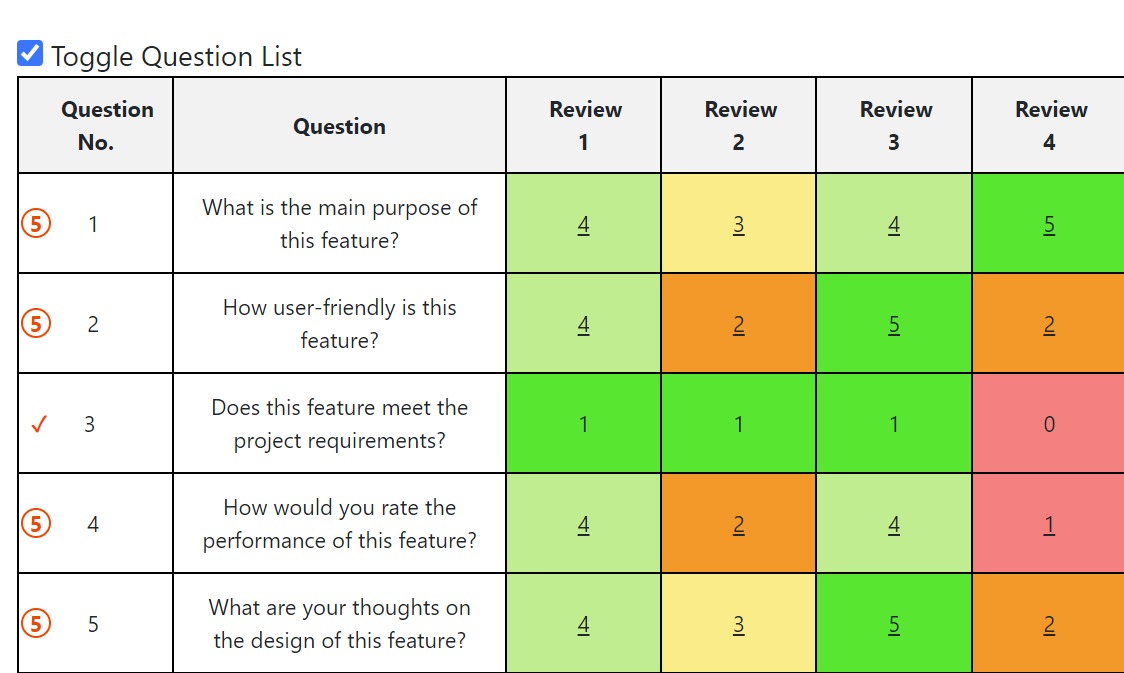
We added a checkbox named Toggle Question List to show the description of each question as a separate column in the HeatMap for which the scores of the reviews are displayed. If the user unselects the checkbox then this questions column disappears. This was done to enhance the user experience so that the user can see the complete description of the questions on which the scores are given in order to understand the scores better. The following screenshot shows the functionality discussed above
Added Show Stats Functionality
We added functionality to show Statistical Data in increasing order which shows the average value of the scores of each review. Also if any section of the review is not present than the whole column is not displayed on the page

Added Show Submission and Hide Submission Buttons
Added show submission button to showcase the links of the submitted files using which the user can directly navigate by clicking on them and also added hide submission button to hide the same. The following is the screenshot that displays this functionality

Removed Unwanted Features
Following are the screenshots of unwanted buttons and features that we removed from the UI

Remove the highlight from the average score
ReImplementation Code
ShowReviews
This file fundamentally contains the logic to display the reviews with their corresponding score and comment. We have iterated through the list of dummy reviews and clubbed them appropriately for a given review. We build a JSX element and push individual UI components into it, thus building the complete list of Reviews.
import React from 'react';
import { getColorClass } from './utils';
import { RootState } from "../../store/store";
import { useDispatch, useSelector } from "react-redux";

//props for the ShowReviews
interface ReviewComment {
  score: number;
  comment?: string;
  name: string;
}

interface Review {
  questionNumber: string;
  questionText: string;
  reviews: ReviewComment[];
  RowAvg: number;
  maxScore: number;
}

interface ShowReviewsProps {
  data: Review[][];
}

//function for ShowReviews
const ShowReviews: React.FC<ShowReviewsProps> = ({ data }) => {
  const rounds = data.length;

  const auth = useSelector(
    (state: RootState) => state.authentication,
    (prev, next) => prev.isAuthenticated === next.isAuthenticated
  );


  // Render each review for every question in each round
  const renderReviews = () => {
    const reviewElements: JSX.Element[] = [];
    for(let r = 0; r < rounds; r++){
      const num_of_questions = data[r].length;

      // Assuming 'reviews' array exists inside the first 'question' of the first 'round'.
      const num_of_reviews = data[r][0].reviews.length;
      reviewElements.push(<div className="round-heading">Round {r+1}</div>)
      for (let i = 0; i < num_of_reviews; i++) {
        if (auth.user.role !== "Student") {
          reviewElements.push(
              <div className="review-heading">Review {i+1}: {data[r][0].reviews[i].name}</div>
          );
        } else {
            reviewElements.push(
                <div className="review-heading">Review {i+1}</div>
            );
        }
        for (let j = 0; j < num_of_questions; j++) {
          reviewElements.push(
            <div key={round-${r}-question-${j}-review-${i}} className="review-block">
              <div className="question">{j+1}. {data[r][j].questionText}</div>
              <div className="score-container">
                <span className={score ${getColorClass(data[r][j].reviews[i].score,data[r][j].maxScore)}}>{data[r][j].reviews[i].score}</span>
                {data[r][j].reviews[i].comment && (
                  <div className="comment">{data[r][j].reviews[i].comment}</div>
                )}
              </div>
            </div>
          );
        }
      }
    }

    return reviewElements;
  };

  return <div>{rounds > 0 ? renderReviews() : <div>No reviews available</div>}</div>;
};

export default ShowReviews;
Statistics
This file renders the Statistical components for the grades information. It includes conditional rendering of tabular components based on whether that specific metric is present or not
// Statistics.tsx
import React,{useState, useEffect} from 'react';
import { calculateAverages } from './utils';
import './grades.scss';
import CircularProgress  from './CircularProgress';
import ShowReviews from './ShowReviews'; //importing show reviews component
import dummyDataRounds from './Data/heatMapData.json'; // Importing dummy data for rounds
import dummyauthorfeedback from './Data/authorFeedback.json'; // Importing dummy data for author feedback
import BarGraph from './BarGraph';
import teammateData from './Data/teammateData.json';
import AverageMarks from './teamMarks';

//props for statistics component
interface StatisticsProps {
  average:string;
}

//statistics component
const Statistics: React.FC<StatisticsProps> = ({average}) => {
  const [sortedData, setSortedData] = useState<any[]>([]);
  useEffect(() => {
    const { averagePeerReviewScore, columnAverages, sortedData } = calculateAverages(dummyDataRounds[0], "asc");
    const rowAvgArray = sortedData.map(item => item.RowAvg);
    console.log(rowAvgArray);
    setSortedData(sortedData.map(item => item.RowAvg));
  }, []);

  const [statisticsVisible, setstatisticsVisible] = useState<boolean>(false);
  const toggleStatisticsVisibility = () => {
      setstatisticsVisible(!statisticsVisible);
  };
  const [showReviews, setShowReviews] = useState(false);
  const [ShowAuthorFeedback, setShowAuthorFeedback] = useState(false);

  // Function to toggle the visibility of ShowReviews component
  const toggleShowReviews = () => {
    setShowReviews(!showReviews);
  };

    // Function to toggle the visibility of ShowAuthorFeedback component
    const toggleAuthorFeedback = () => {
      setShowAuthorFeedback(!ShowAuthorFeedback);
    };

  const headerCellStyle: React.CSSProperties = {
    padding: '10px',
    textAlign: 'center',

  };

  //calculation for total reviews recieved
  let totalReviewsForQuestion1: number = 0;
  dummyDataRounds.forEach(round => {
    round.forEach(question => {
      if (question.questionNumber === "1") {
        totalReviewsForQuestion1 += question.reviews.length;
      }
    });
  });
  //calculation for total feedback recieved
  let totalfeedbackForQuestion1: number = 0;
  dummyauthorfeedback.forEach(round => {
    round.forEach(question => {
      if (question.questionNumber === "1") {
        totalfeedbackForQuestion1 += question.reviews.length;
      }
    });
  });


  const subHeaderCellStyle: React.CSSProperties = {
    padding: '10px',
    textAlign: 'center',
  };

  return (

    <div>

    <table style={{ width: '90%', borderCollapse: 'collapse' }}>
      <thead>
      <a href="#" onClick={(e) => { e.preventDefault(); toggleStatisticsVisibility();}}>
        {statisticsVisible ? 'hide stats' : 'show stats'}
      </a>
      {statisticsVisible && (
     <tr>
     <th style={headerCellStyle}>Stats</th>
     <th style={headerCellStyle} colSpan={2}><BarGraph sortedData={sortedData} /></th>
     <th style={headerCellStyle} colSpan={2}></th>
     {teammateData.length !== 0 && (
           <th style={headerCellStyle} colSpan={2}></th>
          )}

     <th style={headerCellStyle}><CircularProgress size={70} progress={75} strokeWidth={10} /></th>
   </tr>
      )}
        <tr>
          <th style={headerCellStyle}></th>
          <th style={headerCellStyle} colSpan={2}>Submitted Work</th>
          {dummyauthorfeedback[0].length !== 0 && (
            <th style={headerCellStyle} colSpan={2}>Author Feedback</th>
          )}
          {teammateData.length !== 0 && (
            <th style={headerCellStyle} colSpan={2}>Teammate Review</th>
          )}

        </tr>
        <tr>
          <th style={subHeaderCellStyle}>Contributor</th>
          <th style={subHeaderCellStyle}>Average</th>
          <th style={subHeaderCellStyle}>Range</th>
          {dummyauthorfeedback[0].length !== 0 && (
            <th style={subHeaderCellStyle}>Average</th>
          )}
          {dummyauthorfeedback[0].length !== 0 && (
            <th style={subHeaderCellStyle}>Range</th>
          )}
          {teammateData.length !== 0 && (
            <th style={subHeaderCellStyle}>Average</th>
          )}
          {teammateData.length !== 0 && (
            <th style={subHeaderCellStyle}>Range</th>
          )}
          <th style={subHeaderCellStyle}>Final Score</th>
        </tr>
        <tr>
            <td style={subHeaderCellStyle}>
              <div style={{textAlign: 'center' }}>
                <a href="#">ssshah26 </a><span>(Siddharth Shah)</span>
                <br />
              </div>
            </td>
            <td style={subHeaderCellStyle}>
              <div style={{textAlign: 'center' }}>
                <div>{average}</div>
                <a href="#" onClick={(e) => { e.preventDefault(); toggleShowReviews(); }}>
                    {showReviews ? 'Hide Reviews' : 'Show Reviews'}
                </a><span>({totalReviewsForQuestion1})</span>
              </div>
            </td>
            <td style={subHeaderCellStyle}>
              <div style={{textAlign: 'center' }}>
                <div>99.99% - 100%</div>
              </div>
            </td>
            <td style={subHeaderCellStyle}>

              {dummyauthorfeedback[0].length !== 0 && (
                <div style={{textAlign: 'center' }}>
                <div>96.67</div>
                <a href="#" onClick={(e) => { e.preventDefault(); toggleAuthorFeedback(); }}>
                    {ShowAuthorFeedback ? 'Hide Author Feedback' : 'Show Author Feedback'}
                </a><span>({totalfeedbackForQuestion1})</span>
              </div>
              )}
              <div>
      </div>
            </td>
            <td style={subHeaderCellStyle}>
              <div style={{textAlign: 'center' }}>
              {dummyauthorfeedback[0].length !== 0 && (
                <div>87% - 100%</div>
              )}
              </div>
            </td>
            <td style={subHeaderCellStyle}>
              <div style={{textAlign: 'center' }}>
                    {teammateData.length !== 0 && (
                      <div><AverageMarks data={teammateData} /></div>
                    )}
              </div>
            </td>
            <td style={subHeaderCellStyle}>
              <div style={{textAlign: 'center' }}>
              {teammateData.length !== 0 && (
                      <div>90% - 100%</div>
                    )}
              </div>
            </td>
            <td style={subHeaderCellStyle}>
            {teammateData.length !== 0 && (
                      <div style={{textAlign: 'center' }}>
                      <div>75%</div>
                      <div>(in Finished)</div>
                </div>
                    )}

            </td>
          </tr>
      </thead>
      <tbody>
      </tbody>
    </table>
    <div>
        {showReviews && (
          <div>
            <h2>Reviews</h2>
            <ShowReviews data={dummyDataRounds} />
          </div>
        )}
        {ShowAuthorFeedback && (
          <div>
            <h2>Author Feedback</h2>
            <ShowReviews data={dummyauthorfeedback} />
          </div>
        )}
      </div>
   </div>
  );

};

export default Statistics;
BarGraph
This file builds the bar graph for displaying the Average Review scores in a sorted fashion.
import React, { useRef, useEffect } from 'react';
import Chart from 'chart.js/auto';

interface BarGraphProps {
    sortedData: number[];
}

const BarGraph: React.FC<BarGraphProps> = ({ sortedData }) => {
    const chartRef = useRef<HTMLCanvasElement>(null);
    const chartInstanceRef = useRef<Chart | null>(null);

    useEffect(() => {
        if (chartRef.current) {
            const ctx = chartRef.current.getContext('2d');
            if (ctx) {
                if (chartInstanceRef.current) {
                    chartInstanceRef.current.destroy(); // Destroy the previous chart instance
                }
                chartInstanceRef.current = new Chart(ctx, {
                    type: 'bar',
                    data: {
                        labels: sortedData.map((_, index) => Review ${index + 1}),
                        datasets: [{
                            label: 'Average Review Score',
                            data: sortedData,
                            backgroundColor: 'rgba(255, 193, 7)',
                            borderColor:'rgba(255, 193, 7)',
                            borderWidth: 1,
                        }],
                    },
                    options: {
                        scales: {
                            x: {
                                display: false, // Hide the x-axis
                            },
                            y: {
                                display: false,
                                beginAtZero: true,
                            },
                        },
                    },
                });
            }
        }

        return () => {
            if (chartInstanceRef.current) {
                chartInstanceRef.current.destroy(); // Clean up the chart instance on component unmount
            }
        };
    }, [sortedData]);

    return (
        <div  style={{ width: '200px', height:'100px'}}>
            <canvas ref={chartRef } />
        </div>

    );
};

export default BarGraph;
Dummy Data
authorFeedback.json
1. This dummy data provides author feedback received on its corresponding reviews
[
  [
    {
      "questionNumber": "1",
      "questionText": "This reviewer appeared to understand my work.",
      "reviews": [
        { "name": "John", "score": 5, "comment": "The reviewer demonstrated a deep understanding of the work, providing insightful feedback." },
        { "name": "Alice", "score": 3, "comment": "While the reviewer grasped the main points, some aspects could have been clarified further." },
        { "name": "Bob", "score": 4, "comment": "The reviewer's understanding was evident, although certain nuances could have been explored more." },
        { "name": "Emma", "score": 5, "comment": "The reviewer showcased a comprehensive understanding of the work, offering valuable insights." },
        { "name": "Mike", "score": 4, "comment": "The reviewer's comprehension was evident, but a few minor details could have been addressed." }
      ],
      "RowAvg": 0,
      "maxScore": 5
    },
    {
      "questionNumber": "2",
      "questionText": "This reviewer's comments helped me improve my work.",
      "reviews": [
        { "name": "John", "score": 5, "comment": "The reviewer's comments were insightful and contributed significantly to the improvement of the work." },
        { "name": "Alice", "score": 5, "comment": "The reviewer's feedback was instrumental in refining various aspects of the work." },
        { "name": "Bob", "score": 5, "comment": "The reviewer's constructive criticism was invaluable in enhancing the quality of the work." },
        { "name": "Emma", "score": 5, "comment": "The reviewer's suggestions were practical and directly led to improvements in the work." },
        { "name": "Mike", "score": 5, "comment": "The reviewer's feedback played a crucial role in refining the work and addressing potential shortcomings." }
      ],
      "RowAvg": 0,
      "maxScore": 5
    },
and so on
]]
2. This dummy JSON shows the question number, the actual question, the review scores and the review text for this feature.
teammateData.json
[
        {
          "questionNumber": "1",
          "questionText": "How many times was this person late to meetings?",
          "reviews": [
            { "name": "John", "score": 5, "comment": "He was never late for any meeting." },
            { "name": "Alice", "score": 4, "comment": "She was late once due to traffic." },
            { "name": "Bob", "score": 5, "comment": "He was punctual for all meetings." }
          ],
          "RowAvg": 0,
          "maxScore": 5
        },
        {
          "questionNumber": "2",
          "questionText": "How many times did this person fail to show up?",
          "reviews": [
            { "name": "John", "score": 5, "comment": "This never happened." },
            { "name": "Alice", "score": 4, "comment": "She missed one meeting due to illness." },
            { "name": "Bob", "score": 5, "comment": "He never failed to show up." }
          ],
          "RowAvg": 0,
          "maxScore": 5
        },
      and so on
]
Testing
Testing a React website's front end entails confirming that the user interface functions as intended and offers a seamless user experience. To ensure that every UI element works as intended, manual testing was done as follows:
- Component Rendering: All newly added components mentioned above including the "Show Reviews" functionality, "Author Feedback" display, and "Toggle Question List" button, have been successfully implemented in React.js and TypeScript. The modified heat map has also been re-implemented and visually inspected for correct rendering.
- Styling Consistency: The styling for the new and updated components has been confirmed to be consistent with the overall design of the application. Particularly for show stats, show reviews, author feedback, the colour, alignment and font size was made consistent throughout to make the UI look good.
- Functionality Testing: Interactive elements of the newly added features were thoroughly tested. The "Show Reviews" feature correctly displays peer reviews upon activation, the "Author Feedback" section is functional and displays relevant feedback appropriately, and the "Toggle Question List" button effectively shows and hides the question list as intended.
- Responsive Design: The responsiveness of the new features was tested across various devices and screen sizes, confirming a consistent user experience throughout all platforms.
- "Show Submission" Button: Testing confirmed that submissions are correctly displayed with the "Show Submission" button and hidden with the "Hide Submission" button as designed.
- Removed Features: It was confirmed that all features slated for removal have been effectively excluded from the UI, and their absence does not detract from the application's functionality.
- Interface Efficiency: The new UI changes were evaluated for their impact on interface efficiency. The results showed an improvement in intuitiveness and user-friendliness, enhancing the overall user navigation experience within the application.
Important Links
Team
Mentor
- Riya Gori
Members
- Aniket Singh Shaktawat <ashakta@ncsu.edu>
- Pankhi Saini <psaini2@ncsu.edu>
- Siddharth Shah <ssshah26@ncsu.edu>

