CSC/ECE 517 Spring 2023 -G2335. Develop Frontend UI Interface for GraphQL Query
Topic Overview
Motivation
Numerical data are important in providing insights. However, in raw format, numerical data are hard to grasp and introduce more confusion than information. Graphical presentations of numerical data are needed to draw insights and focus from the available data.
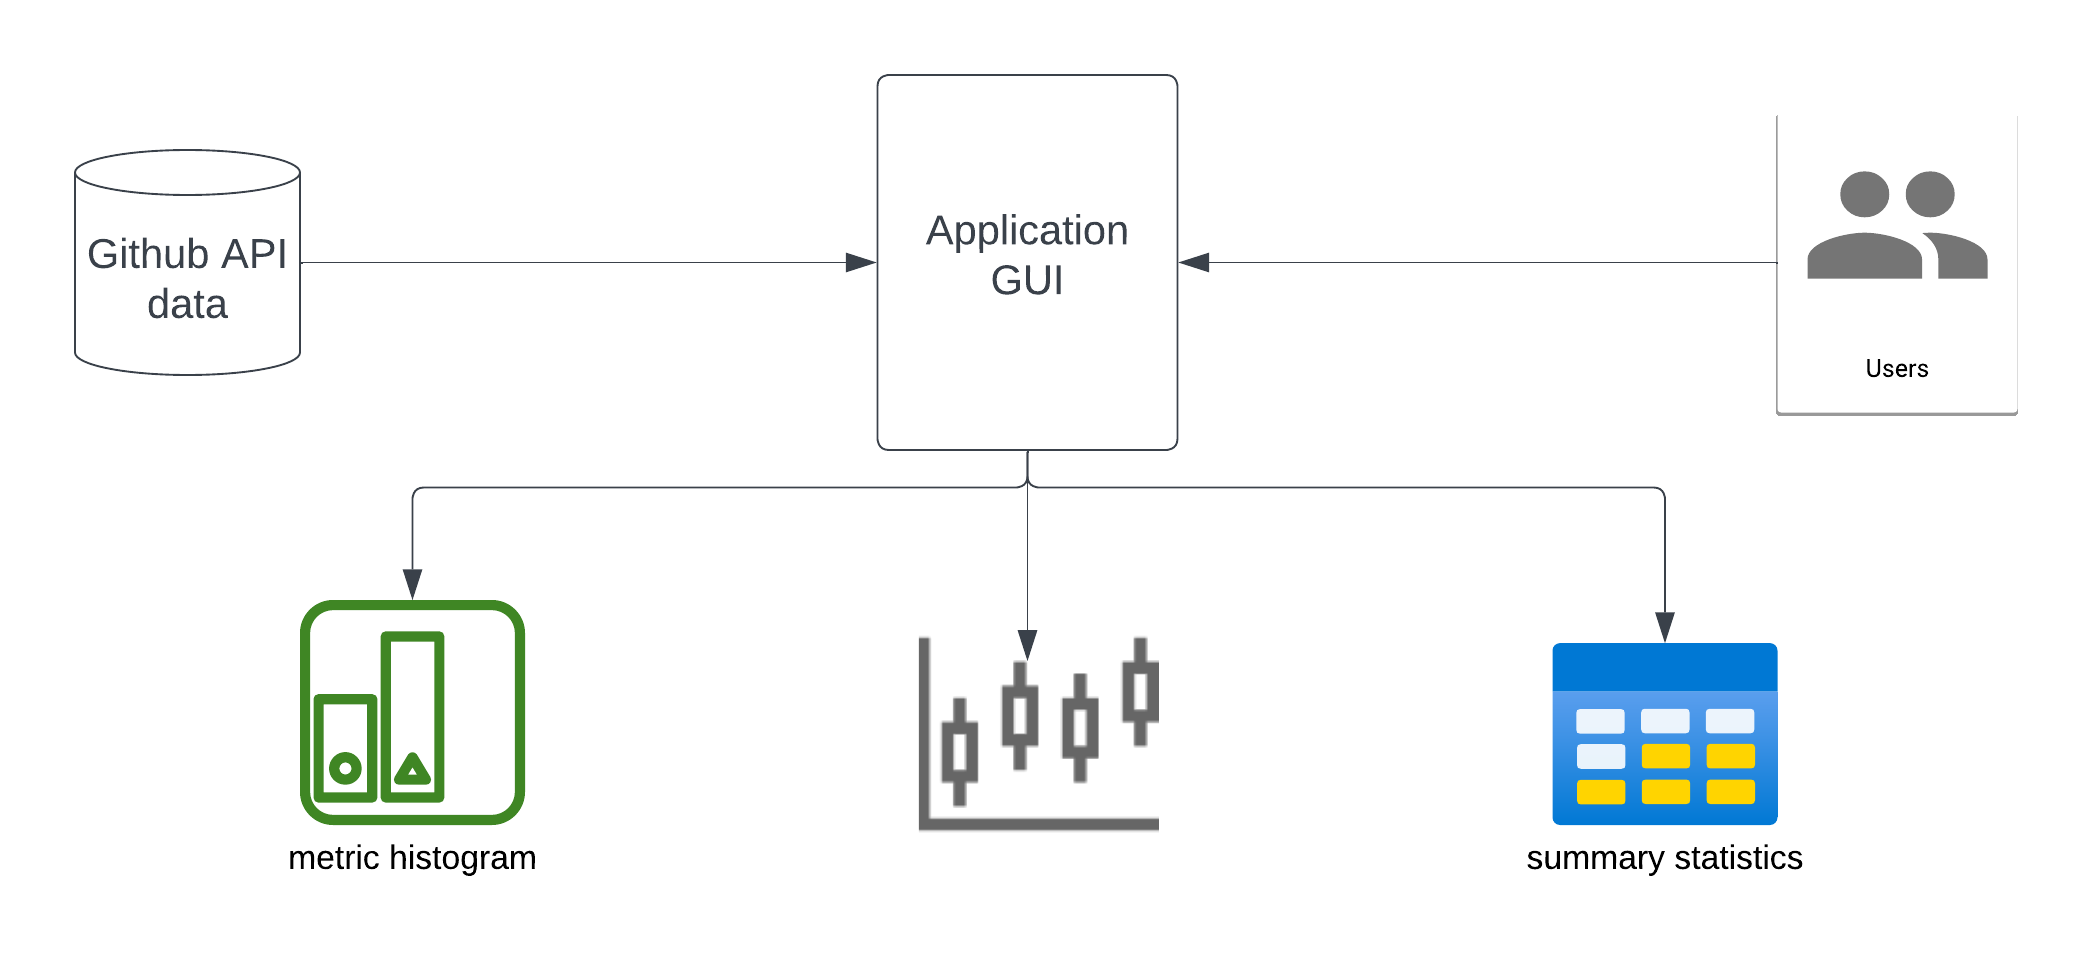
For this project, we are developing the front-end user interface for GraphQL query for a desktop application to display summary statistics of Github repository and Github users' contribution to said repository. Github provides GraphQL API for developers who are interested in the raw data surrounding each Github repository and user. Such data can be used to develop metrics to monitor a repository's activities, performance, community involvement, community usage, and contribution from the community and collaborators. The main focus of this project is developing a UI to display these metrics and summary statistics in graphical and tabular formats to provide clients with insights into their own Github repository or any Github repository they are interested in.
Our interface design will be developed from scratch based on client requirements (project requirements). We aim to make this design and interface a building block and sound foundation for future projects that want to extend our use case or build similar applications.
Scope
As our project focuses on the design and front-end interface of the application, back-end calls to fetch and methods organize data from Github GraphQL API will not be handled. Instead, the data will be stubbed using pre-process datasets in CSV files. These files are the products of data fetched from Github API and organized for ease of accessing and rapid development of the front-end.
Additionally, as the interface will be developed from scratch and the time allotted for this project, we will be focusing on basic displays and graphs of the data.
Feature Requirements
Raw Data
The raw data we are working with contain these fields
| Metrics | Column Names | Definition |
|---|---|---|
| Days | lifeSpan
|
Days of Github experience before class. |
| A | commitContributions
|
The number of private and public commits made by this user. |
| B | commitComments, issueComments, gistComments, repositoryDiscussionComments, repositoryDiscussions
|
The number of comments made by this user in commits, issues, and pull request discussions. |
| C | pullRequests, pullRequestReviewContributions
|
The number of PR and PR reviews made by this user. |
| D | issues, projects
|
The number of issues, and projects created by this user. |
| E | Alanguagecount + Clanguagecount
|
The number of different languages used in user's type I repositories. |
| F | Alanguagesizet + Clanguagesize
|
The size of code written in Github popular languages in user's type I repositories. |
| G | Blanguagecount + Dlanguagecount
|
The number of different languages used in user's type II repositories. |
| H | Blanguagesizet + Dlanguagesize
|
The size of code written in Github popular languages in user's type II repositories. |
| I | repoACount, repoBCount, repoCCount, repoDCount
|
The total number of type I, and type II repositories. |
| J | forkACount, stargazerACount, Awatchers, forkCCount, stargazerCCount, Cwatchers
|
The total number of forks, stars, and watchers in type I repositories. |
| K | forkBCount, stargazerBCount, Bwatchers, forkDCount, stargazerDCount, Dwatchers
|
The total number of forks, stars, and watchers in type II repositories. |
| L | repoASize, repoCSize
|
The total code size of type I repositories. |
| M | repoBSize, repoDSize
|
The total code size of type II repositories. |
Features
The followings are the features that the desktop application is required to have
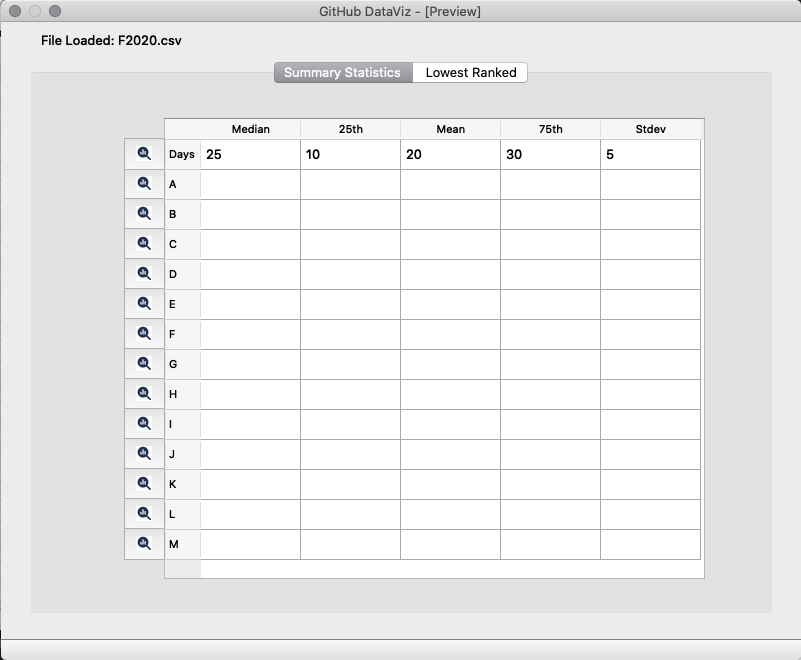
- A table for basic statistics ((median, 25th, mean, 75th percentile, stdev) in the following format
| median | 25th | mean | 75th | stdev | |
|---|---|---|---|---|---|
| Days | |||||
| A | |||||
| ...other metrics... |
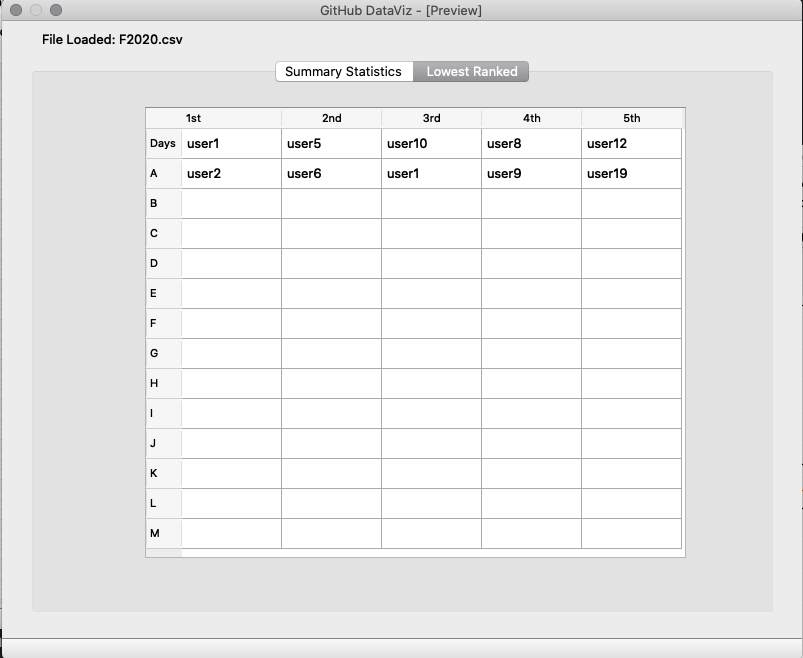
- A table for the lowest ranked 1/5 username in the following format
| 1st | 2nd | 3rd | 4th | 5th | |
|---|---|---|---|---|---|
| Days | USER 10 | USER 2 | USER 6 | USER 18 | USER 21 |
| A | USER 5 | USER 1 | USER 13 | USER 22 | USER 19 |
| ...other metrics... | ... | ... | ... | ... | ... |
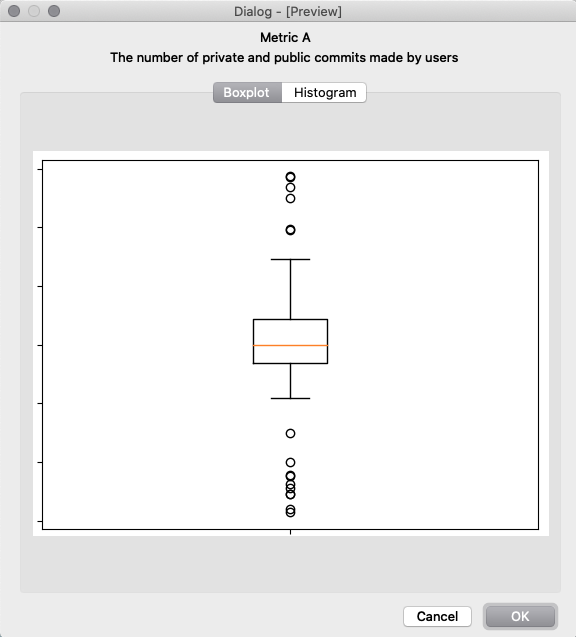
- A boxplot for each of the metrics listed
- A histogram for each of the metrics listed
Interface Design
User Interaction
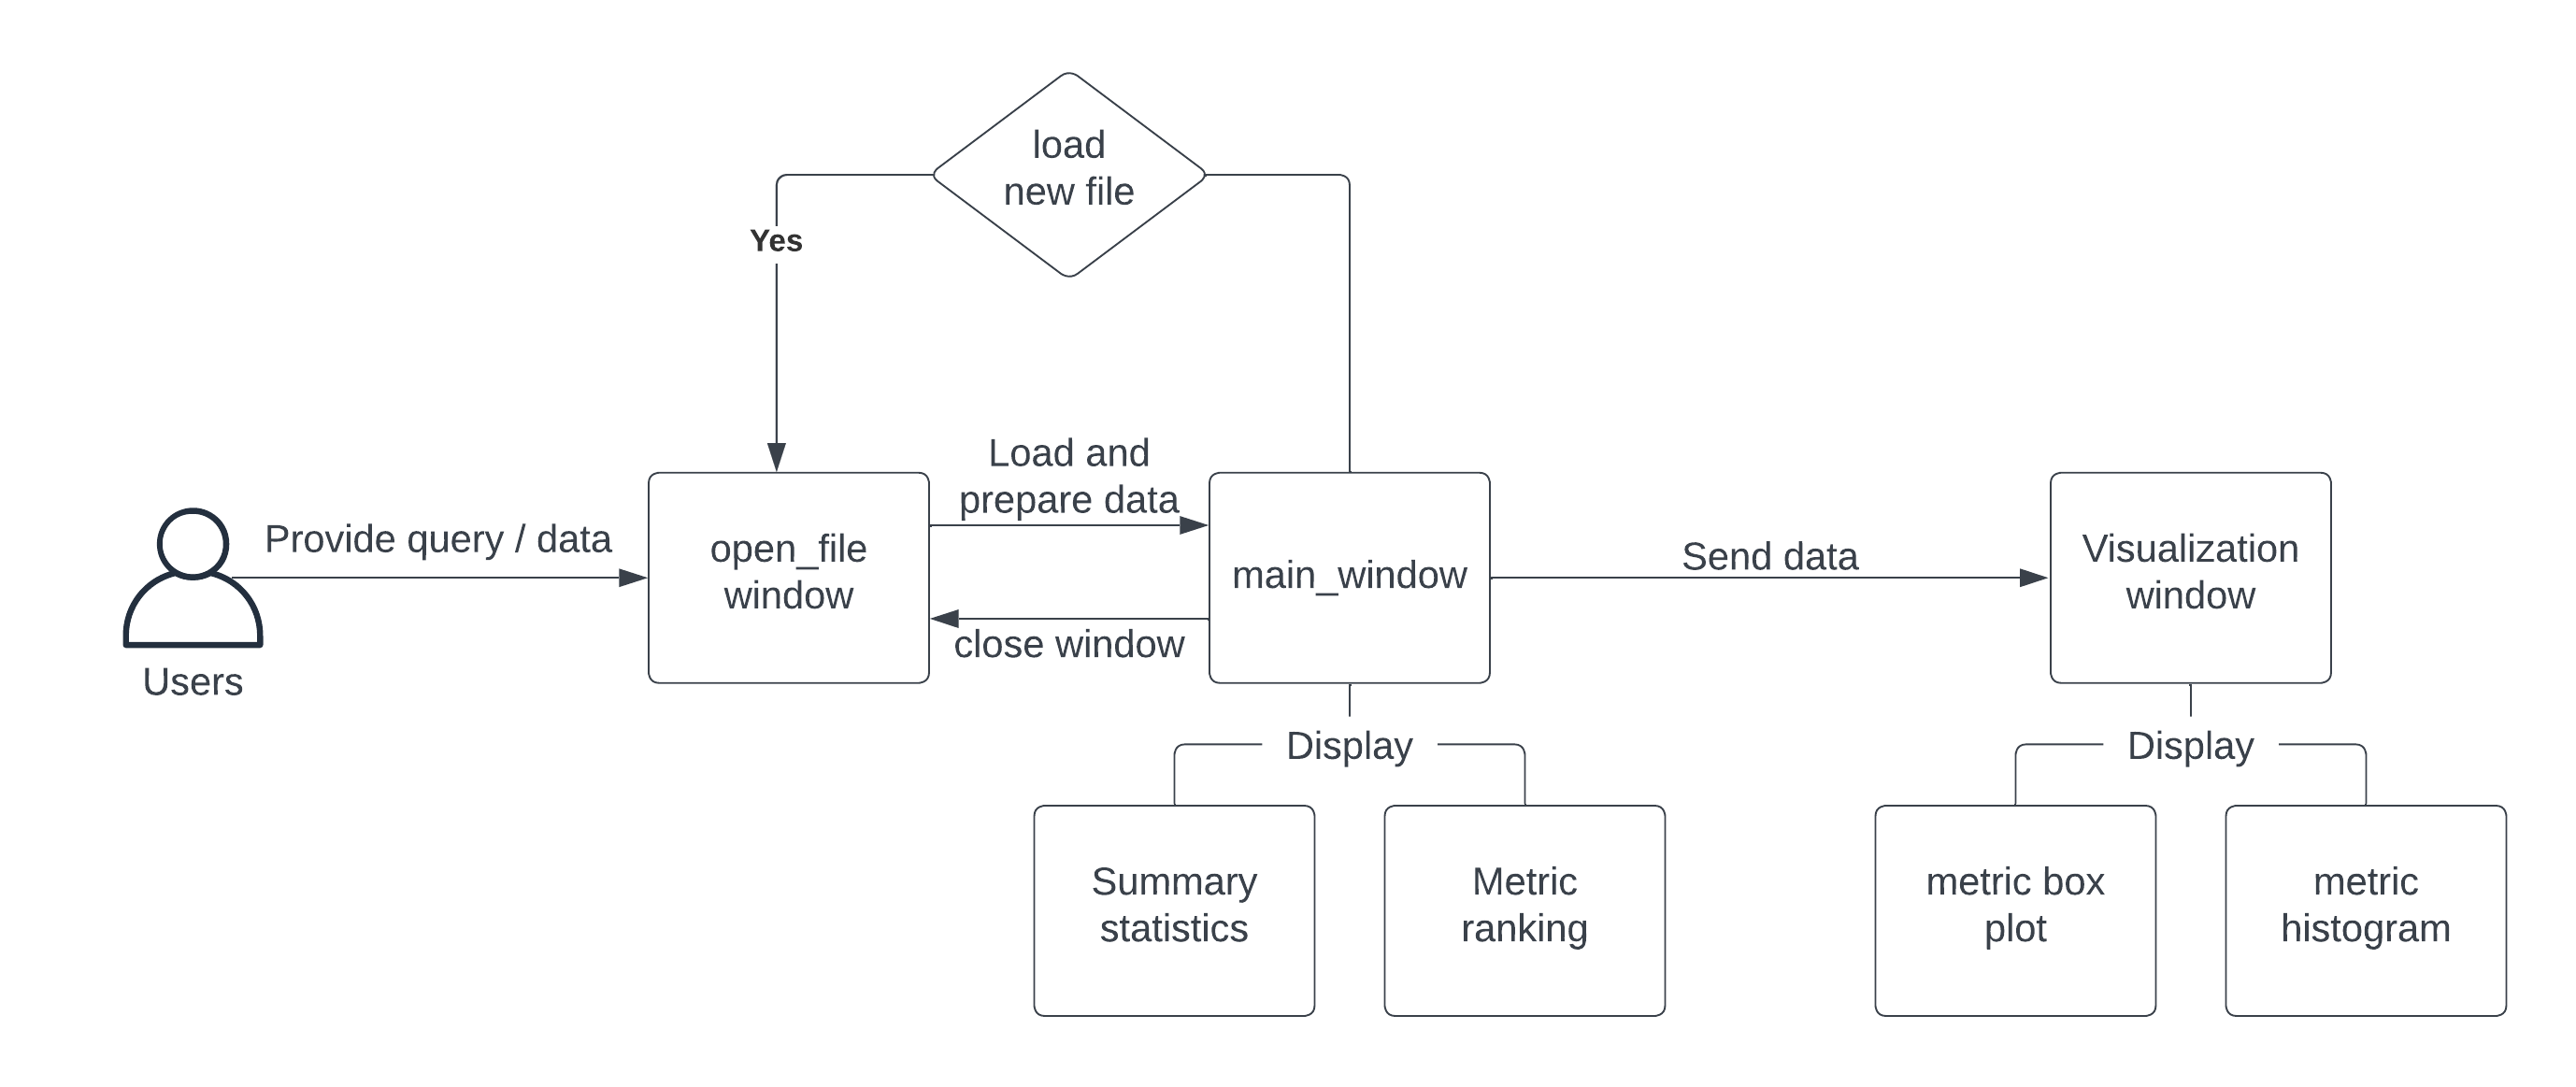
With the GUI of our application, we aim to create an interactive workflow where users can drill into each metric, graph, and summary statistics table by clicking. Thus, prevent a ton of scrolling or production of unnecessary charts that flood the interface. The following graph shows the workflow of our ideal application design
App workflow
The visualization below presents the general workflow of our app.
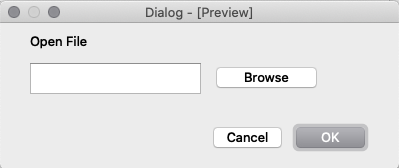
Upon launch, the app starts with a open_file window dialog box which prompts user to load a local file (or enter query input, in the future). The open_file window allows file browsing (in the future, query to GitHub GraphQL API), and upon loading the data, the app will load and preprocess the data for display and computation. Once data is loaded and prepare, main_window opens and this event will close the initial ope_file dialog.
The main window contains two tabs: one for metrics summary statistics and one for ranking users (returned by the query or data file) for each metric. Next to each metric in the summary statistics tab, users will have the option to visualize the metric. Additionally, the main window contains a menu option that allows loading another file (or performing another query). This action will close the report and visualization of current data and load up the new data.
The visualization window contains two tabs: one for box plot and one for histogram. These visualizations provide graphical insights into the chosen metric.
Mockup Design
The mockups below were created using Qt Designer, a graphical interface builder that produces XML-based mockups that can be converted into working python-based pyQt code.
The current design consists of a desktop application that allows the user to browse for and select a csv-based data file (1), loads and processes the data from the csv into tables for summary stats (2) and the lowest ranked users (3) for each metric. On the summary stats table, the user can select the chart icon to bring up a popup that has details about the metric and tabs to show a boxplot (4) and histogram (5) for the selected metric.
1. Open File
2. Summary Stats
3. Lowest Rank
4. Boxplot
5. Histogram
Implementation Details
Tools
The interface for the desktop application will be developed using
- pyQt6 to create front-end components,
- Python (v3) to compute statistics from raw data
- matplotlib to render graphs
- Qt Designer to mock-up the application UI using a drag-drop interface of pyQt
Project Setup and Application Execution
To set up and execute this project follow the instructions below:
- Create a new virtual environment
- Enter the virtual environment
- Install prerequisite Python libraries
Create Virtual Environment
- It is recommended to create a python3 virtual environment to set up and run this application within. To create a virtual environment, from the root of this project:
python3 -m venv ./venv
- Enter the virtual environment by running:
source venv/bin/activate ## mac and linux
venv\Scripts\activate ## windows
- You can exit the virtual environment at any time by running:
deactivate
Install Prereq Libraries
Once within the virtual environment, at initial setup, the prereq Python libraries need to be installed within the environment. To do this run the following from the root of this project:
pip install -r requirements.txt
Run the Application
From within the virtual environment in the root directory (PYQT_UI) run the following command to start the application:
python run.py
Implementation
GUI
We implemented the graphical user interface of our application using PyQt6. Our interface consists of three main windows:
- File Browser Window -- the interface allowing the user to browse and load an input CSV file
- Report Window -- the interface showing two tabs, one for summary statistics for all metrics and one for the lowest ranked users in each metric
- Metric Detail Window -- the interface showing two tabs, one for an boxplot of the selected metric data, and one for a histogram of the selected metric data
We constructed our three windows using the Qt Designer [1] application which allows the laying out and building of a user interface via graphical drag-and-drop methods. The output of Qt Designer are .ui files which are an XML format file that describes the user interface elements and properties.
With the .ui files, there are two methods to using them within the PyQt library:
- Generating python class source code directly from the .ui file(s) for insertion into the application or,
- Reading the .ui files in directly during the execution of the python application which constructs the GUI objects on the fly at runtime.
Since the application is small and performance with our sample data was not an issue, we elected for the second method to generate the GUI objects on the fly. Additionally we are able to version the XML .ui files and directly tweak elements within the XML to manipulate the interface.
Each of our windows has a python class and a paired .ui file that is loaded by the class when it is instantiated. An example of this from the FileWindow class within app/gui/file_window.py:
  ROOT_DIR = os.path.dirname(os.path.abspath(__file__))
  DESIGNER_OPEN_FILE = os.path.join(ROOT_DIR,"designer","file_window.ui")
  self.ui = uic.loadUi(DESIGNER_OPEN_FILE, self)
From there the ui objects can be referenced to hook up interaction events with the rest of the application. Continuing the above example, the file browse and load buttons are hooked to downstream browseFile() and openReport() functions:
  self.ui.browseButton.clicked.connect(self.browseFile)
  self.ui.loadFileButton.clicked.connect(self.openReport)
In addition to our three main windows, we use a singleton class called Main (app/gui/main.py) that is responsible for all programmatic opening/closing of windows such that a single version of the current state of the application is kept by that object. Instantiated window objects have a pointer to this Main class which allows windows to interact with one another, for instance to single the report window to open once the file window has loaded a CSV.
File browsing/loading and summary statistics tables
The app starts with a browse/load file dialog box that prompts the user to provide data for the report. Browse button opens file explorer on the user's machine and allows the user to search for the file they need. Based on how the data is organized behind the scene and the tools we're currently using, our app only accepts files with CSV extension. Our app accesses the machine's file explorer system and safeguards the file type using the following code.
  ## browse csv file using file explorer
  def browseFile(self):
      filename = QFileDialog.getOpenFileName(self, 'Open File', '.', 'CSV Files (*.csv)')
      self.filename = filename[0]
      self.ui.pathToFileTextbox.setText(self.filename)
The text box next to browse button display the path of the chosen file on the user's machine. This text box will not allow the user to manually enter the path to the file or edit the path of the file browsed. This is to avoid human error while interacting with the file's path. The load function of the open_file window also further checks the validity of the path using the following code. If the path of a file is invalid, a dialog box will pop up to notify the user as such. Note that, the validity of the path to a file is not checked until the load button is clicked. This is to prevent situations in which the user browses a valid file through the machine's file explorer, but the file, under whatever circumstances, gets deleted between after browsing is done and before loading is finished.
  ## check the validity of user-entered filename
  def _isValidFile(self):
      return self.filename and os.path.isfile(self.filename) and self.filename[-4:] == '.csv'

  ## load csv file
  def loadFile(self):
      if not self._isValidFile():
          return self.raiseMissingFilenameError()
      metric_constructor = Metrics(self.filename)
      metric_constructor.constructMetricsTable()
      self.data = metric_constructor.get_datatable()
Behind the scene, the load button also performs the following functionalities upon activation and before the main window loads
- Computes the metric values (columns) for each user (row) [1]
- Compute summary statistics for each metric using the data resulted from computation in [1]
- Compute user ranking for each metric using the data resulted from computation in [1]
- Organize the summary statistics into pandas dataframe for display
- Organize the ranking data into pandas dataframe for display
Visualization
Once a CSV has been loaded and the Report Window appears, the detail icon to the left of each metric row can be selected to launch the Metric Detail Window. This window consists of a tabbed interface allowing the toggling between Boxplot and Histogram visual representations of the underlying metric data. The class responsible for initializing the window and visualizations is app.gui.metric_detail_window.MetricDetailWindow().
The boxplot and histogram visualizations are constructed via the matplotlib library which is initialized in a special manner to allow use within the PyQt library. These imports were demonstrated in a useful example at https://www.pythonguis.com/tutorials/pyqt6-plotting-matplotlib/ and are included below for reference:
import matplotlib
matplotlib.use('QtAgg')

from PyQt6 import uic
from PyQt6.QtGui import QAction
from PyQt6.QtWidgets import (
    QDialog
)

from matplotlib.backends.backend_qt5agg import FigureCanvasQTAgg
from matplotlib.figure import Figure
The MetricDetailWindow class is instantiated with a pointer to the parent Main() as well as the associated metric identifier, summary data, and histogram data used to construct the visualizations. The window is labeled with the metric identifier and a short description of the metric from a currently hardcoded dictionary within the class. The boxplot and histogram matplotlib figures are initialized via the app.gui.metric_detail_window.MplCanvas() class from the input data which was derived within app/data/compute_statistics.py.
The boxplot is constructed per the following:
boxplot_data = [{
    'label': "",
   'whislo': float(metric_summary_data['Min']),
   'q1': float(metric_summary_data['25th']),
   'med': float(metric_summary_data['Median']),
   'q3': float(metric_summary_data['75th']),
    whishi': float(metric_summary_data['Max']),
    'fliers': []
}]
sc.axes.bxp(boxplot_data, showfliers=False)
The histogram is constructed per the following:
sc.axes.hist(self.histogram_data)
Default matplotlib settings are used for both visualizations -- this is an area where possible tweaks to the application could be beneficial.
Testing
Test execution
- Before you run your test make sure you Install Prereq Libraries:
pip install -r requirements.txt
- To run different test cases:
pytest tests/test.py
Test plan
| Test No | Test Description | Expected Output | Test Result |
|---|---|---|---|
| 1 | Test that the browseFile method opens the file dialog | A file dialog should appear and the file name should not be empty | PASS |
| 1.2 | Test that the loadFile method loads the file correctly | User should be able to load csv file in their device | PASS |
| 2 | Test if the file is valid | User should be able to select a valid CSV file is selected, Invalid files should trigger an error message | PASS |
| 3 | Test getSummaryStatistics function | It verifies that the function returns a DataFrame, if DataFrame has the expected columns and also that the DataFrame has the expected index | PASS |
| 4 | Test getHistogramData function | It verifies if function returns a Series, if series has the expected length and that the values are numeric | PASS |
| 5 | Test constructMetricsTable method | It verifies if the constructMetricsTable method generates the expected data frame with the correct columns and dimensions | PASS |
Details
- Browse File:
In this test, we verify that the browseFile() method of the FileWindow class opens a file dialog correctly. A qtbot fixture is passed as an argument to this fixture. For testing PyQt-based GUI applications, the pytest-qt library provides the qtbot fixture. It then asserts that the filename attribute of the FileWindow instance is not empty, indicating that the user has selected a file.
@pytest.fixture
def file_window(qtbot):
# Create a FileWindow instance for testing and show it
    file_window = FileWindow(None)
    file_window.show()
# Test that the browseFile method opens the file dialog
    with qtbot.waitSignal(file_window.ui.pathToFileTextbox.textChanged):
        file_window.browseFile()
        assert file_window.filename != ''
- Load File:
A file can be selected from a local machine and loaded into the application(particularly CSV file). This functionality is essential to the application's primary purpose, which is to analyze data for users.
# Test that the loadFile method loads the file correctly
    file_window.loadFile()
    assert file_window.data is not None
    qtbot.addWidget(file_window)
    return file_window
- Valid / Invalid files:
The first test function, "test_is_valid_file", checks if a CSV file exists by mocking the "isfile" function from the "os.path" module. And the second test function, "test_invalid_file", checks if a file with a TXT format does not exist by mocking the "isfile" function to always return false.
def test_is_valid_file(qtbot, file_window, monkeypatch):
    # Test if the file is valid
    filename = "CSV Files (*.csv)"
    file_window.filename = filename
    def mock_return(*args, **kwargs):
        return True
    monkeypatch.setattr(os.path, "isfile", mock_return)


def test_invalid_file(qtbot, file_window, monkeypatch):
    # Test if the file is invalid
    filename = "TXT Files (*.txt)"
    file_window.filename = filename
    def mock_return(*args, **kwargs):
        return False
    monkeypatch.setattr(os.path, "isfile", mock_return)
- getSummaryStatistics:
This test determines whether a given input dataset's summary statistics, such as the median, 25th percentile, mean, 75th percentile, standard deviation, minimum, and maximum, are accurately computed by the getSummaryStatistics function. It makes use of NumPy and Pandas for creating a random dataset, which it then gives to the getSummaryStatistics method. The test verifies whether a Pandas DataFrame with the anticipated columns and index is properly returned by the function.
def test_getSummaryStatistics():
    # Test that the function returns a DataFrame
    result = getSummaryStatistics(data)
    assert isinstance(result, pd.DataFrame)

    # Test that the DataFrame has the expected columns
    expected_columns = ['Median', '25th', 'Mean', '75th', 'Stdev', 'Min', 'Max']
    assert result.columns.tolist() == expected_columns

    # Test that the DataFrame has the expected index
    expected_index = data.columns.tolist()
    assert result.index.tolist() == expected_index
- getHistogramData:
This test checks whether a particular input dataset and metric has been utilized by the getHistogramData method to compute histogram data correctly. Using NumPy and Pandas, the program generates a random dataset and chooses the first column in that dataset as the metric. Following that, this dataset and metric are passed to the getHistogramData function. The function's accuracy in returning a Pandas Series with the desired length and data type is checked in this test. It also tests that the values are numeric.
def test_getHistogramData():
    # Test that the function returns a Series
    metric = data.columns[0]
    result = getHistogramData(data, metric)
    assert isinstance(result, pd.Series)

    # Test that the Series has the expected length
    expected_length = len(data)
    assert len(result) == expected_length

    # Test that the values are numeric
    assert result.dtype == 'float64'
- constructMetricsTable:
This test validates whether the Metrics class' constructMetricsTable method correctly creates a Pandas DataFrame from the imported data. It first creates a Metrics object using the metrics_obj fixture mentioned above before invoking the constructMetricsTable function. The resulting Pandas DataFrame is tested to determine if the intended column names and shape are there.
# Test for constructMetricsTable method
def test_constructMetricsTable(metrics_obj):
    # Test the output of the method
    metrics_obj.constructMetricsTable()
    df = metrics_obj.get_datatable()
    assert 'lifespan' in df.columns
    assert 'A' in df.columns
    assert 'B' in df.columns
    assert 'C' in df.columns
    assert 'D' in df.columns
    assert 'E' in df.columns
    assert 'F' in df.columns
    assert 'G' in df.columns
    assert 'H' in df.columns
    assert 'I' in df.columns
    assert 'J' in df.columns
    assert 'K' in df.columns
    assert 'L' in df.columns
    assert 'M' in df.columns
    assert df.shape == (52, 15)
Test Result
End point summary
Data Ingestion and Processing
We will use the python unittest framework to implement unit testing of classes responsible for reading in the input CSVs and executing the metrics within including the functions supporting boxplot, histogram, and basic statistics generation/calculations.
PyQt Interface
We will use the pytest-qt package to implement our testing of the user interface. We expect that given the nature of UI testing, our tests may not be fully comprehensive of all situations/environments, but we will attempt to test all major events within the UI (e.g., button presses triggering appropriate actions, data appearing correctly in tables).
See also: Python unit testing for pyQt
Future Work
For this project, our goal is to develop a solid foundation for a desktop application that reports Github data in an informative manner. Our design focuses on displaying the most imperative information to users while avoiding requiring users to engage in complex and unnecessary interactions. We focus on a simple graphical view to avoid overwhelming users with multiple graphs and data.
As a front-end project, our application contains mainly front-end components with a few basic functions behind the scene that do computation and rendering graphs. The backend data pipeline is stubbed using pre-processed CSV files of data fetched manually from Github GraphQL API. However, the connection between the data and the GUI is designed so that the GUI can work with a full-fledged data pipeline. As a result, for future work, we hope to extend our application functionality so that it has a functional backend data pipeline that can take in a user input command to fetch data directly from Github API, process it, and then display information.
Besides having a fully functional application with a backend data pipeline, the following features can be added to the application:
- Users can combine graphs and compare metrics.
- Users can compare the performance and metrics of a Github account to another (or multiple other) account(s).
- Users can manually add texts and annotations to graphs generated by the application.
- Users can export graphs and reports into pdf or image formats (e.g., PNG, and JPEG)
Keeping the future direction in mind, we will design and build the UI to enable as clean as possible of a switch between loading the data from CSV to loading the data via API. One such area of potential reuse/repurpose would be the portions of the application (GUI, controller, and model classes) responsible for taking in an input file -- in our case, the data itself will be ingested, but in the future state, a CSV of GitHub usernames may serve as the entry point.
Additionally, our current code reads and processes .ui files (which are XML files of our app interface generated by the Qt Designer app) and then adds functions to the UI using Python code. The fact that our code has to read and process XML files first slows down our app on start-up. In the future, this could be avoided by converting the XML files into Python codes and objects and work with them directly without having to read and process the .ui files
Contributors
- Aileen Jacob (amjacob2)
- Anh Nguyen (anguyen9)
- Joe Johnson (jdjohns4)
- Mentor Jialin Cui (jcui9)
