CSC/ECE 517 Spring 2021 - E2100. Tagging report for students
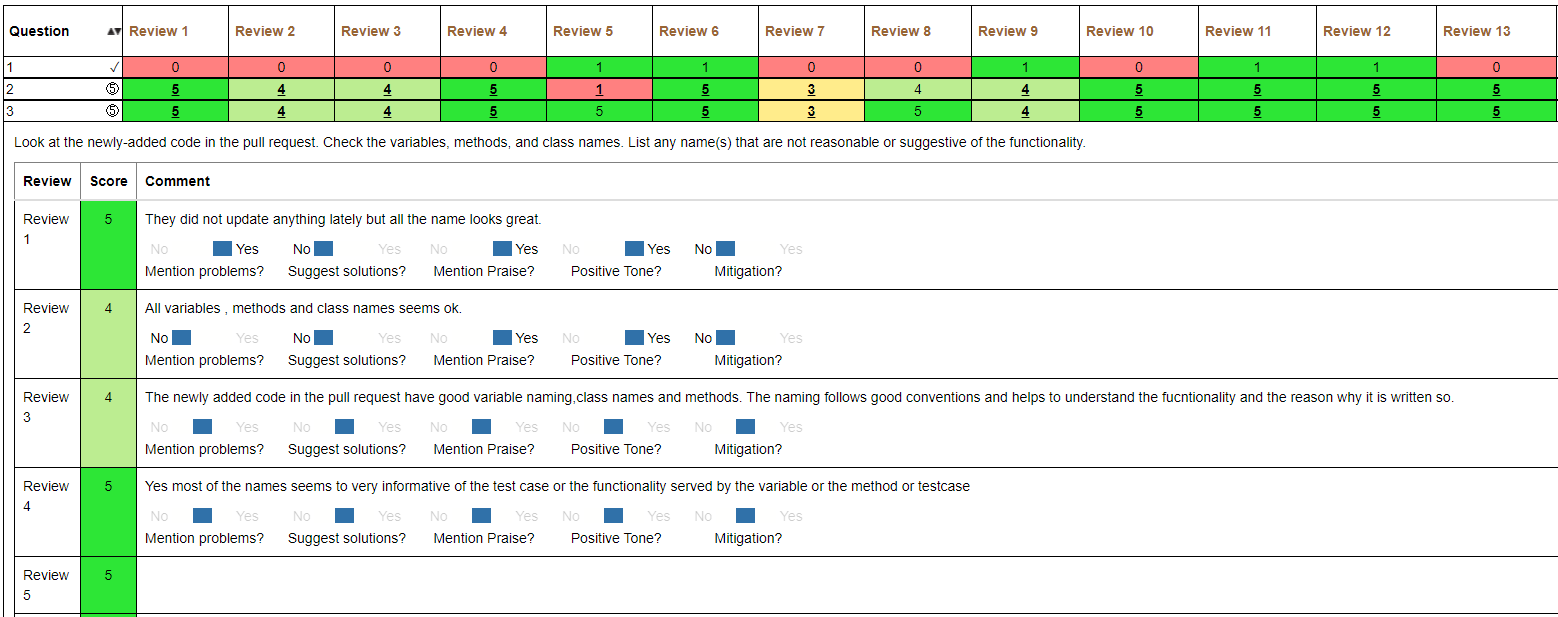
This page details project documentation for the Spring 2021, "E2100 Tagging report for students" project, which aims to assist students with finding, and completing, incomplete "review tags" on an assignment using a dynamically generated heatgrid.
Introduction to Expertiza
Expertiza is an Open Source Rails application which is used by instructors and students for creating assignments and submitting peer reviews. Expertiza allows the instructor to create and customize assignments, create a list of topics the students can sign up for, have students work on teams and then review each other's assignments at the end. The Source code of the application can be cloned from Github.
About Review Tagging
Review "tags" are a form of feedback on Expertiza where students "tag" (classify) text from peer reviews, using Yes or No answers to questions chosen specifically for each tag deployment. The parameters can include helpfulness, positivity, suggestions, whether a review offered mitigation, and other parameters depending on the Answer Tag Deployment, and the number of tags per deployment is arbitrary. These labeled data are then made available to Expertiza researchers for use in developing Natural Language Processing (NLP) / Machine Learning (ML) algorithms. Tagging is only collected for reviews where the reviewer wrote enough words to be useful as labeled data for NLP research.
Problem Statement
It can be difficult for students to find a tag they missed on the Team View page, and other teams are working with ML algorithms to "pre-tag" as many reviews as possible, leading to a granular field of completed/incomplete tags. For example, an assignment with two rounds of reviewing, ten questions per review, twelve reviews, and a 5-parameter tag deployment could contain as few as zero or as many as one thousand, two hundred tag prompts for a single student to complete.
At this time, the only tagging feedback students see are the tag prompts and a Javascript counter with a numeric representation of how many tags have not been completed. In order to find a missed tag, students have to scroll the page and manually search for tags that aren't done.
In order to help students complete all the tags for an assignment, we propose a new, dynamically generated heatgrid on the "Your Scores" view that breaks down reviews and tags by round, question, and review, which uses visual cues to help students find incomplete tags. The heatgrid shows both a total count of "complete" out of "available" tags, and individual tags with color-scaled feedback for completeness.
The new heatgrid must handle these requirements, and display visual feedback accordingly:
- Single and multiple round reviews
- Reviews with and without tag prompts
- Dynamically update as tags are completed
- Different tag deployments will use different numbers of tags per review
- Use of existing review row-sort functionality
- Not rely on the database for tag data, as AnswerTag database rows may not exist until tags are clicked.
- Give useable feedback for all users (characters as well as color-coding)
- Only be shown when a tags have been deployed to an assignment
- Show the total progress of tagging in the format, "249 out of 315"
Implementation
The pull request for our implementation may be found at Github.
Our proposed solution is a visual feedback aid, primarily for student users. Tagging data, when input, is stored to the database dynamically using jQuery. For these reasons, and to facilitate dynamic updates, we have chosen to implement this functionality entirely on the client-side of the application using Javascript and jQuery.
Design Patterns
The feedback aid consists of a new heat grid using an HTML table, dynamically generated client side with Javascript, that uses jQuery to extract the requisite data from the page. The design of this new feature utilizes properties of the Adapter and Observer design patterns. Observer is implemented with the collection of tag prompts and associated functions acting as the Publisher, and the cells of the Tagging Report acting as subscribers. Only the cells which correspond to reviews eligible for tagging are subscribed to the publisher, and whenever a member of the tag prompts collection is changed, the subscribers receive a status update. Properties of the Adapter pattern are present in the code which adapts from the existing backend, where Tag objects are not created until they are populated by the NLP algorithm or clicked by a student, to the heatgrid which must be able to find and display all questions and tags, regardless of their status or backend implementation.
Flow Diagram
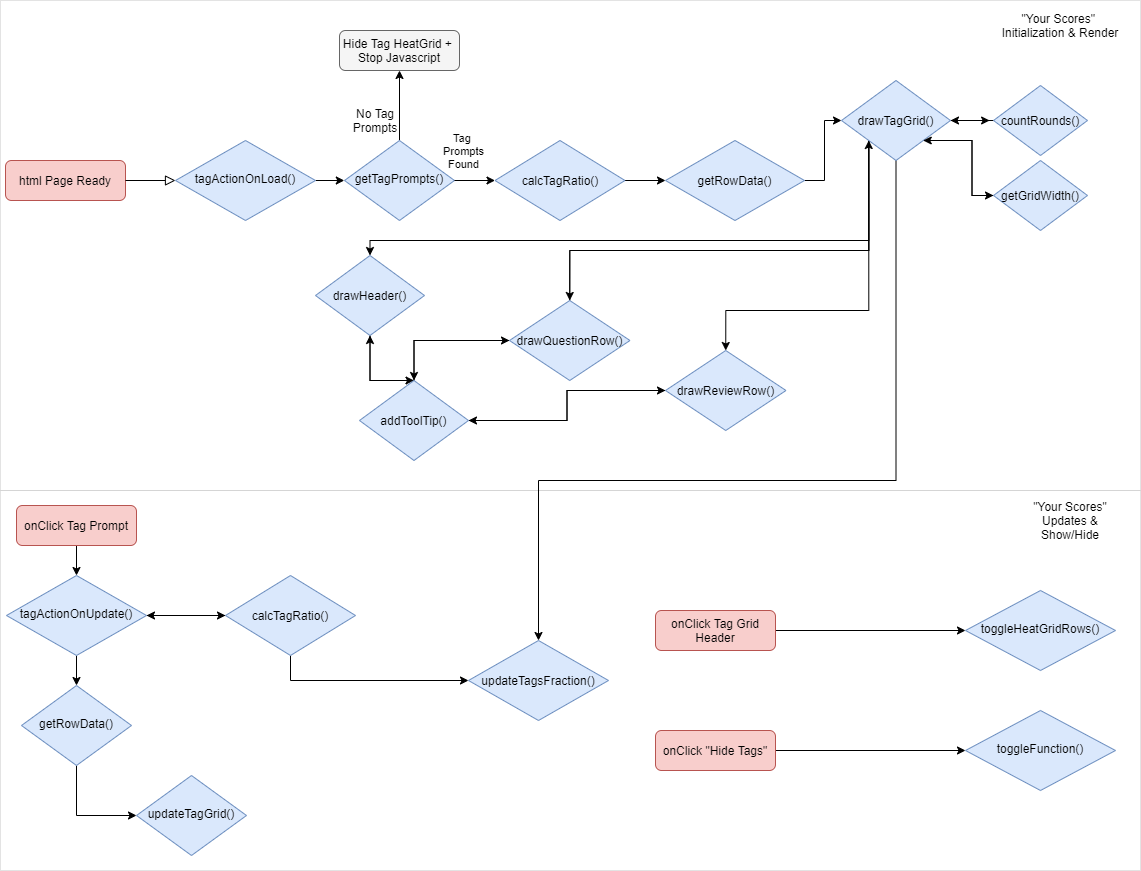
The presence or absence of tag prompts are detected at page load, and the heat grid is rendered as appropriate. The flowchart below details the new Javascript functions which were implemented to accomplish this goal, and the associated program flow.
Your Scores Implementation Flow Diagram
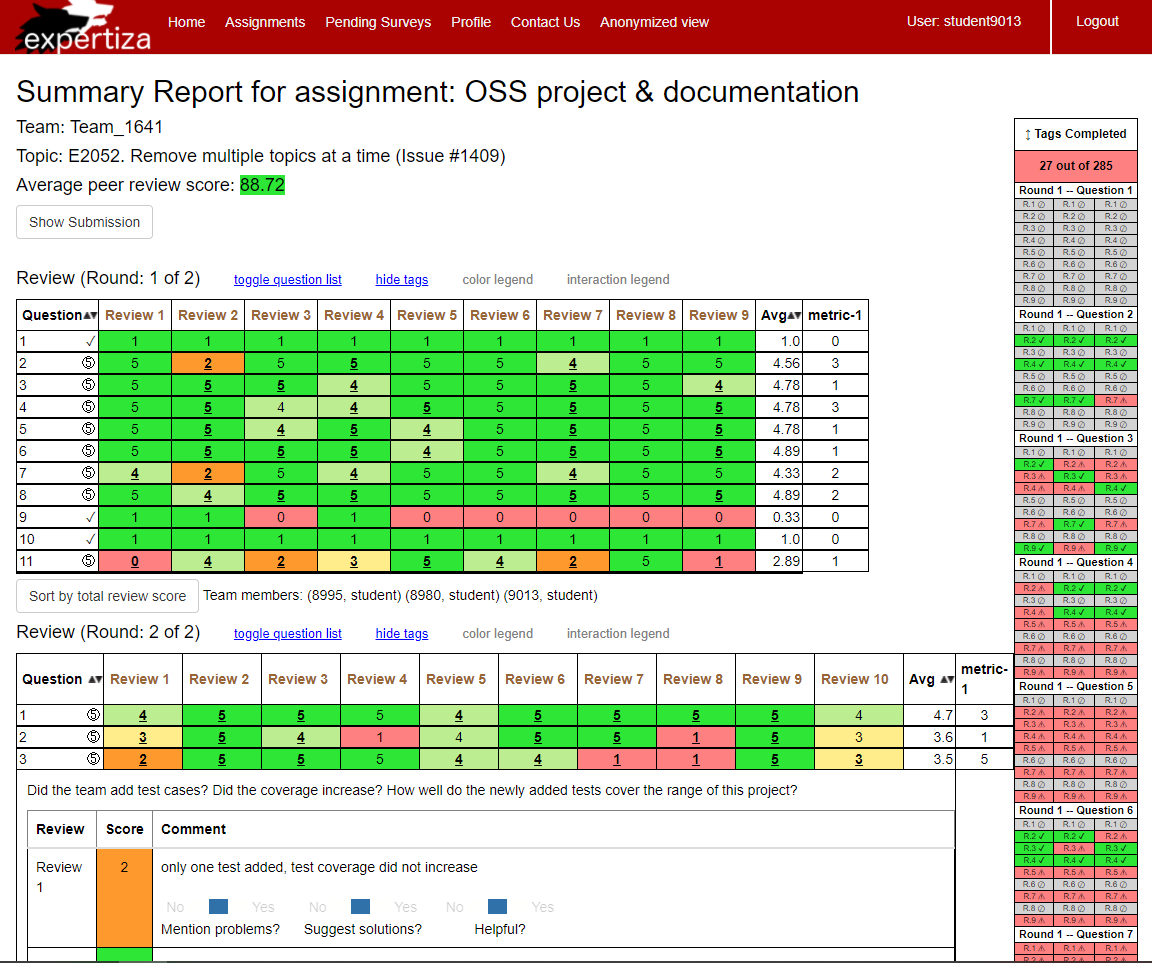
Heat grid for a two-round review
Code Style
A note on code style: Because this project utilizes so much Javascript, we tried to keep the code style consistent and true to best practices for both Ruby and Javascript, depending on which language we were working in. Therefore, any code or variables from the Ruby section should use snake_case, and code in the Javascript section should use lowerCamelCase.
Server-Side Implementation: "Your Scores" and "Alternate View"
Because most of the logic is implemented on the client side, the server-side implementation is fairly simple.
"Your Scores" view (/views/grades/view_team.html.erb)
We added an empty HTML <table> tag with id and tag information that is used to generate the heatgrid with Javascript.
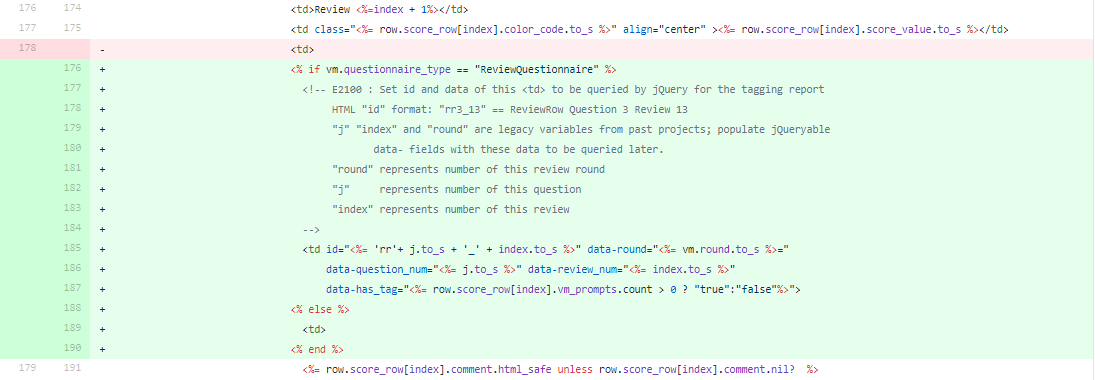
In order to simplify the jQuery which parses the rendered page for tags, we added three numeric and one boolean jQueryable data- fields and a new id field to the td container tag which holds each review text (and the associated tags, if present). We used existing Rails variables to populate these data and id fields. The id is set using "rr" for reviewrow (shortened for brevity) plus the question and review number (j and index). We also created fields for data-round (round number) data-question_num (question number), data-review_num (review number), and data-has_tag (boolean whether tags exist).
Style Note: the "data-" is the key queried by jQuery, so a dash is used. The string after the dash is free for us to choose the style, so we used Ruby style to match the convention on the rest of the application.
Finally, we added a call inside the document.Ready() event handler to tagActionOnLoad(), which starts the rendering code for the client-side Javascript once the page has loaded and tags (if available) are present for counting. We also added a jQuery of our new heat grid table within the onClick for the "Hide Tags" link to ensure our heatgrid is hidden when tag prompts are hidden.
"Alternate View" (/views/grades/view_my_scores.html.erb)
We added function calls to countTotalTags() and countTaggedTags() inside the document.Ready() event handler to calculate the total number of tags and the total number of tagged tags on the page that currently being rendered. We also added div HTML element with id tag_stats and render this element with string "Tag Finished: tagged_tags/total_tags". For example, if there are 370 tags in total on this page and 10 of them have already been tagged, then 10/370 will be displayed. This element will also be updated dynamically when users make tag changes on this page.
Client-Side Implementation: "Your Scores" (view_team.html.erb)
The majority of the logic is implemented on the client side. After the page is loaded and the rest of the ReactJS interface is rendered, a dynamically rendered heatgrid is rendered on the "Your Scores" view. A series of functions included in Javascript asset files view_team_in_grades.js and answer_tags.js are called which render the appropriate element for each view. These functions are described below, organized in calling order.
Initialization and Rendering - view_team_in_grades.js
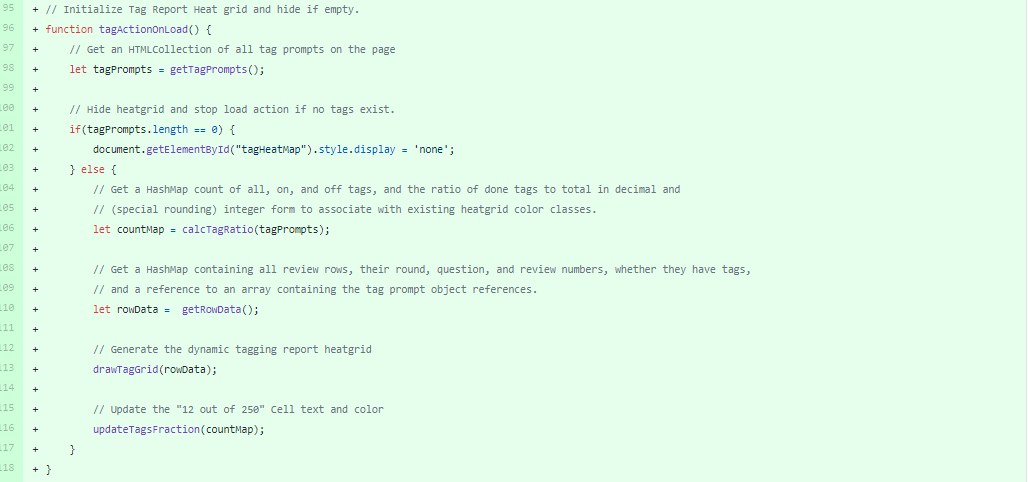
tagActionOnLoad()
Called by document.Ready() event handler, this function first calls getTagPrompts(), determines if zero exist, and exits if so. If tag prompts exist, it continues to call other functions which query the page for information and render the tag heatgrid.
getTagPrompts()
A simple Javascript query that collects all the tag prompts as an HTMLCollection for use with other function.
calcTagRatio()
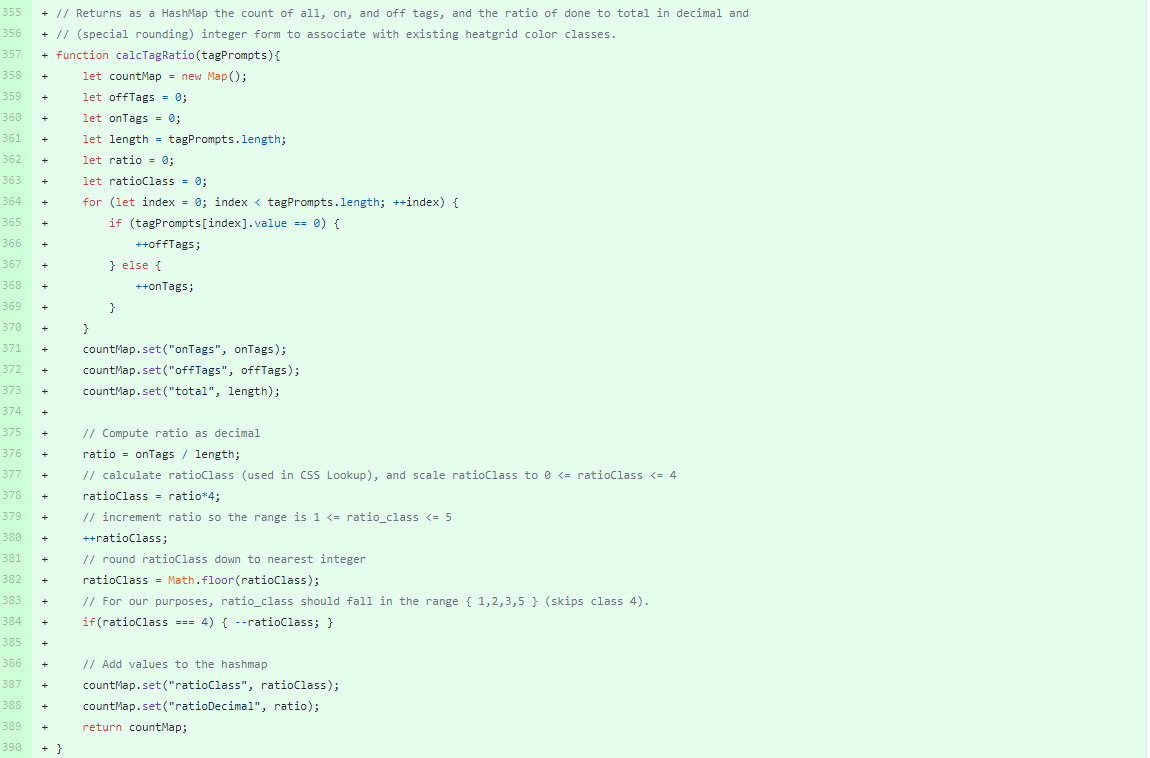
A mathematics helper function that uses the tag prompt collection to gather data used in populating the tag heatgrid header ("tag fraction") which reads, for example, "25 out of 350". This function gathers all the numeric data, as well as calculating the completion ratio as a decimal and adapting this decimal to a value that can be used to reference heatgrid color classes (c0 grey, c1 red, c2 orange, c3 yellow, c4 light green, c5 dark green). Note that we avoided using the light green class because it's too easily confused with dark green -- meaning "all done" -- so logic in this function ensures we skip straight from c3 yellow @ .9999 completion, to c5 dark green at 1.0000 completion.
getRowData()
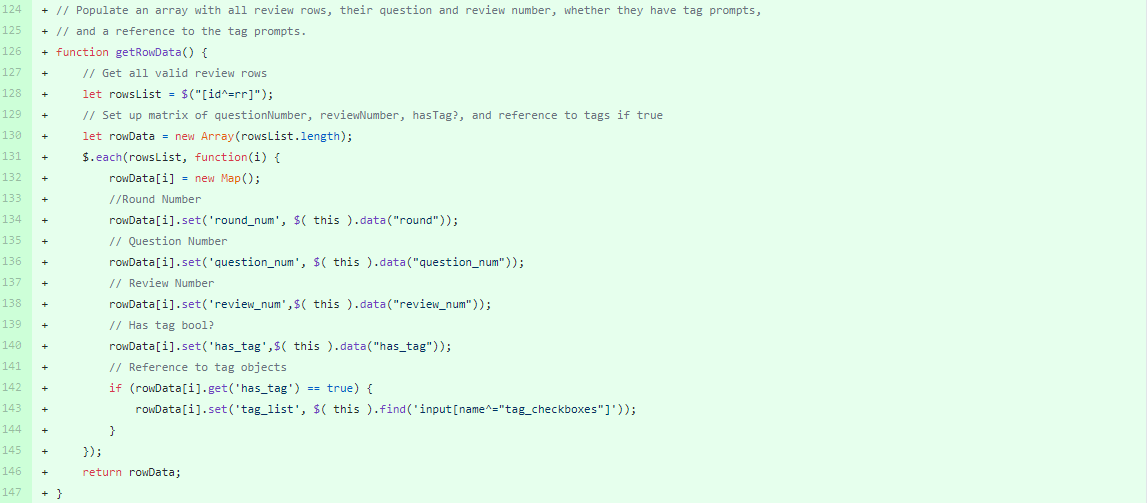
This method uses jQuery to retrieve the row containers for all questions in all rounds of this review, whether they contain tag prompts or not. This allows us to populate the heatgrid with 'grey - universal No-symbol' for reviews whose length metric is too low to have a tag prompt associated.
countRounds()
This function parses the rows of the review to determine how many rounds of reviews exist in the assignment. This allows us to intelligently print "Round 2 -- Question 3" for multi round reviews, or "Question 3" for single round reviews.
getGridWidth()
This function parses the row data to determine how many tag prompts were used in this deployment using a simple selection search for the largest number of tags in a review. Since different tag deployments use different numbers of prompts, the rendering of the heatgrid needs to address this flexibility. Furthermore, the design of this function will allow for future flexibility of tag deployments, i.e., where different reviews in the same assignment or round may have different numbers of tags.
drawTagGrid()
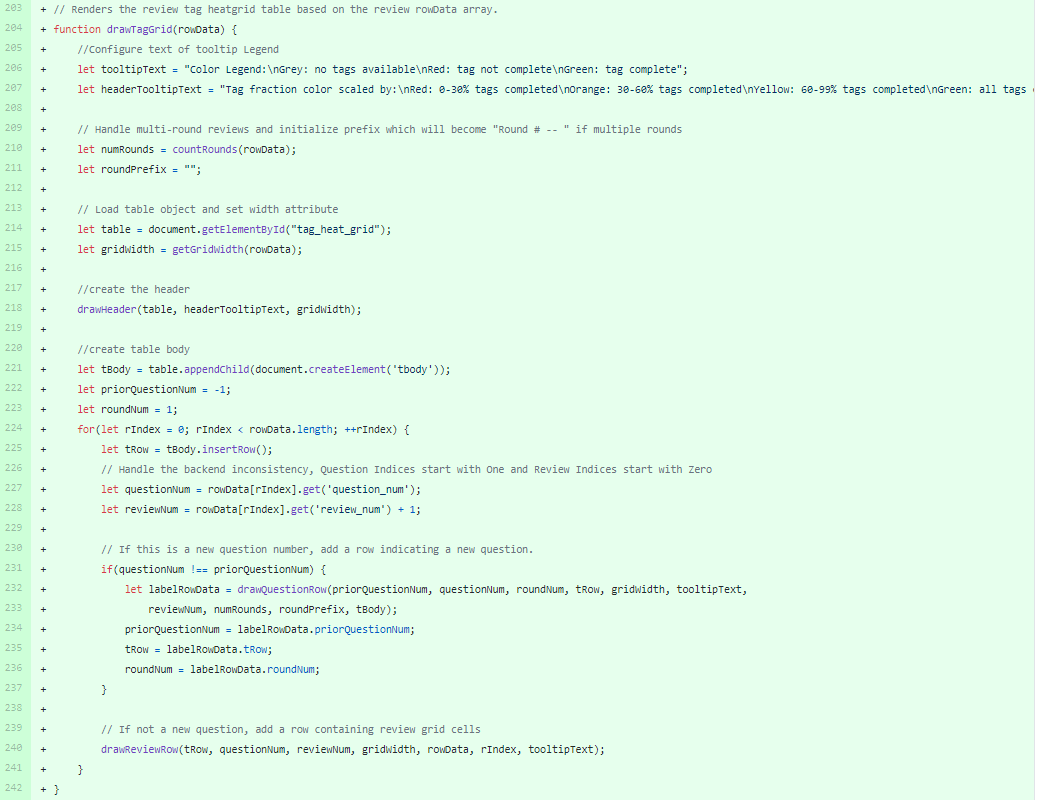
This is the master function for the rendering of the tag grid. This function sets up tooltip text, calls countRounds() and getGridWidth() and passes control to the three sub-functions, drawHeader(), drawQuestionRow(), and drawReviewRow(), depending on what type of item needs to be rendered next.
drawHeader()
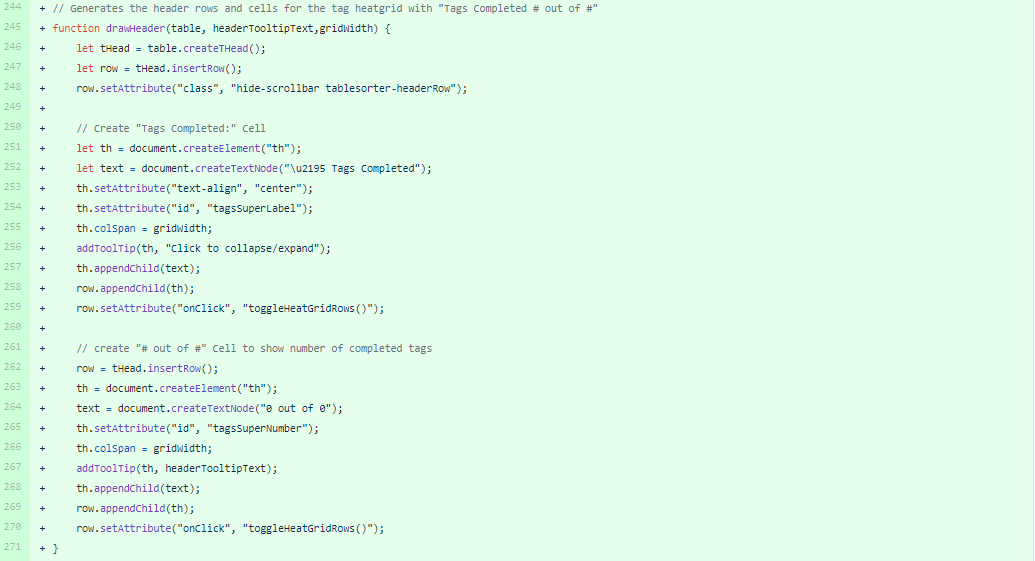
This function draws the two-row header of the tag heatgrid which will contain "Tags Completed" and "15 out of 425". It also calls addToolTip() to add the tooltips for expand/contract, and the color legend for the tag fraction row.
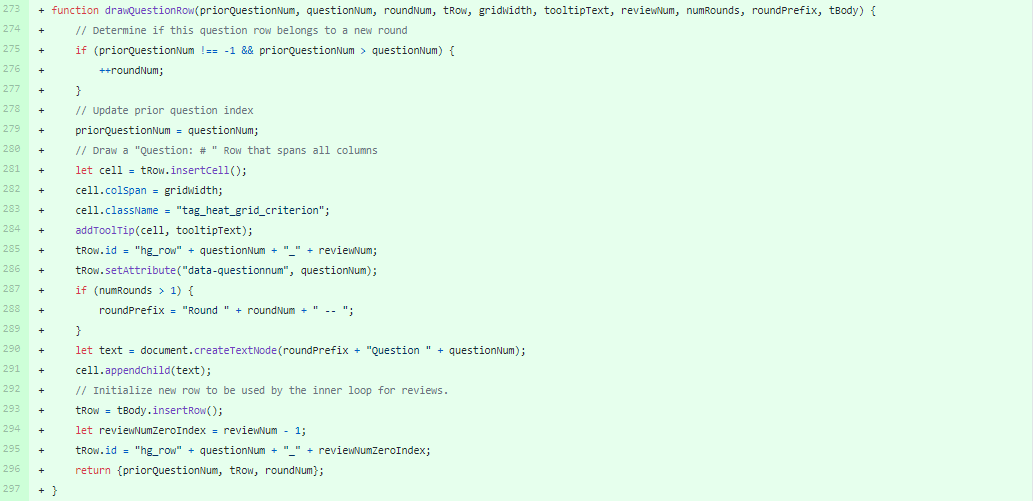
drawQuestionRow()
This function is called once per question during the rendering process, and draws the row which will read, "Question 3" or "Round 2 -- Question 3". This also calls addToolTip() to add a color legend tooltip for the body of the heatgrid.
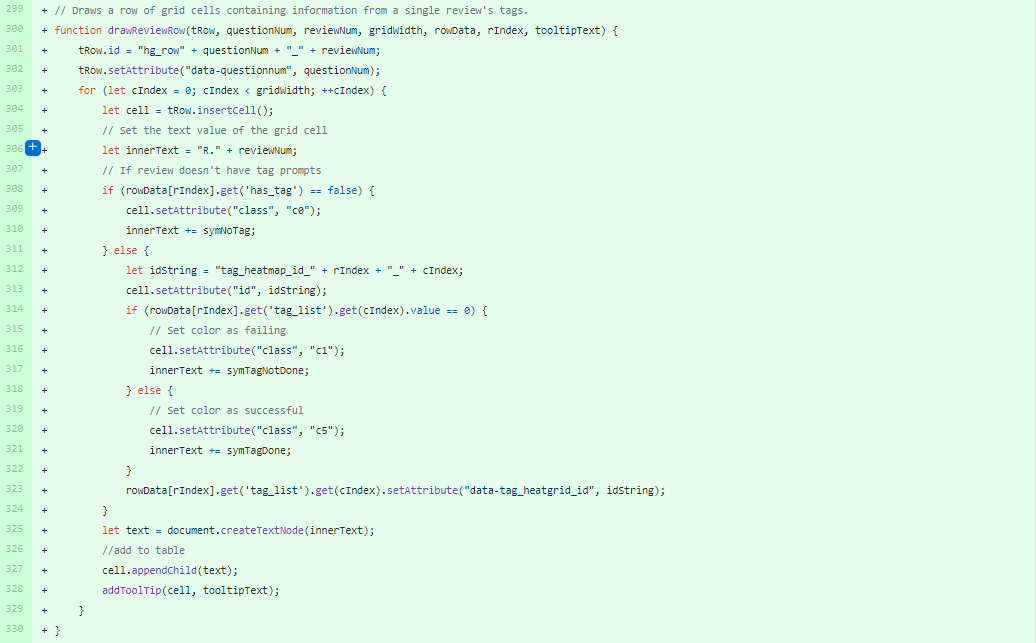
drawReviewRow()
This function draws each row containing the presence, or absence of, tag prompts for each review. These contain R.# (Review.number), and a unicode symbol (set in the global variables). The unicode symbol is to enable accessibility for users who cannot see the red/green spectrum clearly, and will be populated with either a Universal No to mean no tags available, a Warning symbol, to mean tags not done, or a Check-Mark to indicate tags done.
Lastly, a call is made to updateTagsFraction() as part of the initial render to update the "12 out of 230" header row in the tag grid.
Updating and Interaction Functions - view_team_in_grades.js
tagActionOnUpdate()
Each time a tag prompt is changed, this function is called to update the heatgrid. This function calls several other functions, some of which have been used previously it the rendering step.
updateTagsFraction()
This function is used both once in the rendering step, and again each time a tag prompt is changed. This function takes the data from calcTagRatio() and updates the contents and color of the header row in the tag heatgrid ("12 out of 220")
updateTagGrid()
This function queries the tag prompts on the page, and uses these data to update the tag heatgrid class and text.
toggleHeatGridRows()
This function "Collapses" the heatgrid down to only the two header rows. Note that this function is called both onClick of the heatgrid header, so a user can collapse the grid manually, and automatically when the tag fraction is updated. This ensures that a user visiting the page with all tags complete will see a collapsed heatgrid by default.
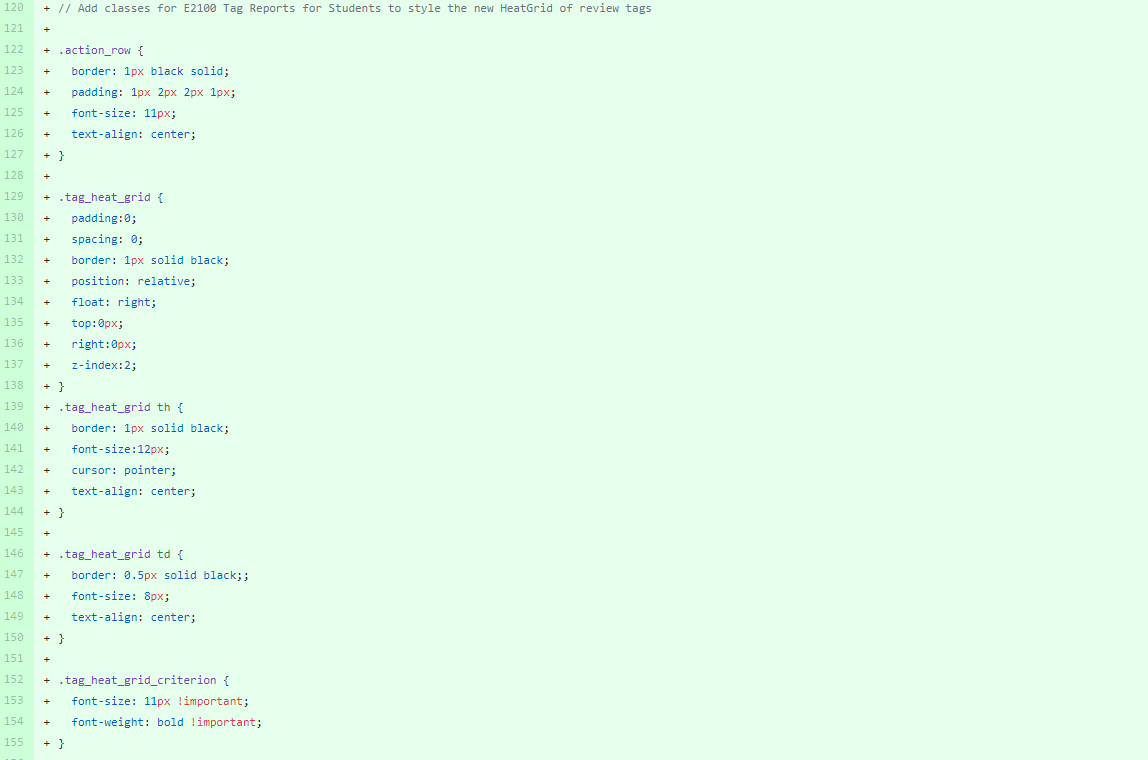
Stylesheets - grades.scss
We augmented the stylesheets used in grades so that the new heatgrid could be styled as small as possible to save page real estate. To do so, we added new classes in grades.scss
Client-Side Implementation: "Alternate View" (view_my_scores.html.erb)
countTotalTags()
A simple JS function to count all the tag elements on current page. It will be invoked when the page first being rendered and also when any tags are changed by users.

countTaggedTags()
A simple JS function to count the number of tagged tags on the current page. It will be invoked when the page first being rendered and when any tags are changed by users.

Additional Logic Check
This JS helper dynamically render the page when any tags are changed by users. Since we adopt different logic on two view pages, we added a condition check to tell which page we are on and apply the corresponding logic.

Test Plan
Functional Testing
Since we did not make any changes to the models, controllers, or the database backend of Expertiza, we did construct any new RSpec tests for any model or controller behavior.
We did perform functional testing using Capybara, to ensure that our changes to the Embedded Ruby views work and are preserved in future modifications of the code.
Our new functional test was placed within spec/features. The file is named view_team_spec.rb and its purpose is to ensure that the table for the heatgrid is generated when accessing the "Your Scores" section. We built this new test using some code from pre-existing feature tests, namely peer_review_spec.rb, which tests the functionality of user access and leaving a review for another project.
You can run our created feature test with the following command in the expertiza directory.
rspec spec/features/view_team_spec.rb
Expected Output: 1 example, 0 failures
Capybara Test Code
The following section of code sets up the tests with factory methods located in spec/factories/factories.rb. It creates a User First and Second who are located on Team 1, a User Third who is located on Team 2. It also maps the third user to review team 1 and the first and second users to review team 2.
 before(:each) do
   create(:assignment, name: "TestAssignment", directory_path: 'test_assignment')
   create_list(:participant, 3)
   create(:assignment_node)
   create(:deadline_type, name: "submission")
   create(:deadline_type, name: "review")
   create(:deadline_type, name: "metareview")
   create(:deadline_type, name: "drop_topic")
   create(:deadline_type, name: "signup")
   create(:deadline_type, name: "team_formation")
   create(:deadline_right)
   create(:deadline_right, name: 'Late')
   create(:deadline_right, name: 'OK')
   create(:assignment_due_date, deadline_type: DeadlineType.where(name: 'review').first, due_at: Time.now.in_time_zone + 1.day)
   create(:topic)
   create(:topic, topic_name: "TestReview")
   create(:team_user, user: User.where(role_id: 1).first)
   create(:team_user, user: User.where(role_id: 1).second)
   create(:assignment_team)
   create(:team_user, user: User.where(role_id: 1).third, team: AssignmentTeam.second)
   create(:signed_up_team)
   create(:signed_up_team, team_id: 2, topic: SignUpTopic.second)
   create(:assignment_questionnaire)
   create(:question)
   create(:submission_record)
   create(:submission_record, team_id: 2)
   create(:review_response_map, reviewer_id: User.where(role_id: 1).third.id)
   create(:review_response_map, reviewer_id: User.where(role_id: 1).first.id, reviewee: AssignmentTeam.second)
   create(:review_response_map, reviewer_id: User.where(role_id: 1).second.id, reviewee: AssignmentTeam.second)
   create(:review_grade, review_graded_at: Time.now.in_time_zone)
 end
The following section of code executes the common functionality used in the test of logging in as the third user and then navigating to their "Your Scores" page.
 def load_your_scores
   login_as(User.where(role_id:1).third.name)
   expect(page).to have_content "User: " + User.where(role_id:1).third.name
   click_link "Assignments"
   expect(page).to have_content "TestAssignment"
   click_link "TestAssignment"
   expect(page).to have_content "Submit or Review work for TestAssignment"
   expect(page).to have_content "Your scores"
   expect(page).to have_content "Alternate View"
   click_link "Your scores"
   expect(page).to have_content 'Summary Report for assignment: TestAssignment'
 end
The next section of code is the add_review method, which logs in as the first user and adds a review to team 2 which the third user is a part of. This section of code was heavy influenced by "peer_review_spec.rb"
 def add_review
   login_as(User.where(role_id:1).first.name)
   expect(page).to have_content "User: " + User.where(role_id:1).first.name
   expect(page).to have_content "TestAssignment"
   click_link "TestAssignment"
   expect(page).to have_content "Submit or Review work for TestAssignment"
   expect(page).to have_content "Others' work"
   click_link "Others' work"
   expect(page).to have_content 'Reviews for "TestAssignment"'
   choose "topic_id"
   click_button "Request a new submission to review"
   click_link "Begin"
   fill_in "responses[0][comment]", with: "HelloWorld"
   select 3, from: "responses[0][score]"
   click_button "Submit Review"
   expect(page).to have_content "Your response was successfully saved."
   click_link "Logout"
 end
The final section of our test is the actual feature test that checks the heatmap. This section of the code utilizes both of the above defined "load_your_scores" and "add_review" methods to accomplish the task of viewing the heatmap for the third User.
 it "Should contain html target and javascript calls for tag heatgrid" do
   # Load Summary Report with no reviews
   load_your_scores
   expect(page).to have_content "Average peer review score: "
   # Add review as first user
   click_link "Logout"
   add_review
   # View Your Scores with one review
   load_your_scores
   # Check for target to build new heatgrid onto
   expect(page.body).to include '<table id="tag_heat_grid" class="tag_heat_grid"></table>'
   # Check for Javascript action to generate the heatgrid
   expect(page.body).to include 'tagActionOnLoad();'
   # Check for Javascript action to turn the heatgrid on and off with answer tag toggle
   expect(page.body).to include "$('.tag_heat_grid').toggle();"
 end
Acceptance Testing
For manual testing purposes, we logged in as instructor6 in order to:
- View the tagging report as an instructor/TA (Instructor tagging is permitted, and tags are separate from Student Tags) on view_team
- Impersonate a student to view the tagging report on view_team as a student
- View the mini-report on Alternate View both as students and instructors
- Ensure that changing of tags updates the Tagging Report
- Ensure that the Tagging Report interacts well with the existing layout
- Ensure that the Tagging Report is hidden/shown when "Hide Tags" is clicked
- Ensure that the Tagging Report accordions as expected when clicked
- Confirm that mouseover events display the expected tooltips, including color scheme for the "10 out of 250" cell as well as color scheme for the main report body, and the Expand/Collapse tooltip
- Ensure that the Tagging Report is hidden when there are no Tags available for a view_team page
- Ensure that the Tagging Report was compatible with different tag deployments containing different numbers of tags
A good example of functionality for a project with reviews and one with reviews can both be found with student7856. Program 2 has plenty of reviews that can be tagged and untagged and checked that the heatmap functionality is working. Program 1 does not have any reviews to tag and was checked to ensure that nothing broke due to not having any reviews to tag.
Manual Acceptance Testing Instructions
1. Login to Expertiza using production link hosted on Amazon Web Services. Use user id: instructor6 with password: password
2. Navigate to an assignment that has a tag deployment. Many recent assignments (2017-present) which have reviews have tag deployments. Click "Assignments", then the submissions icon.
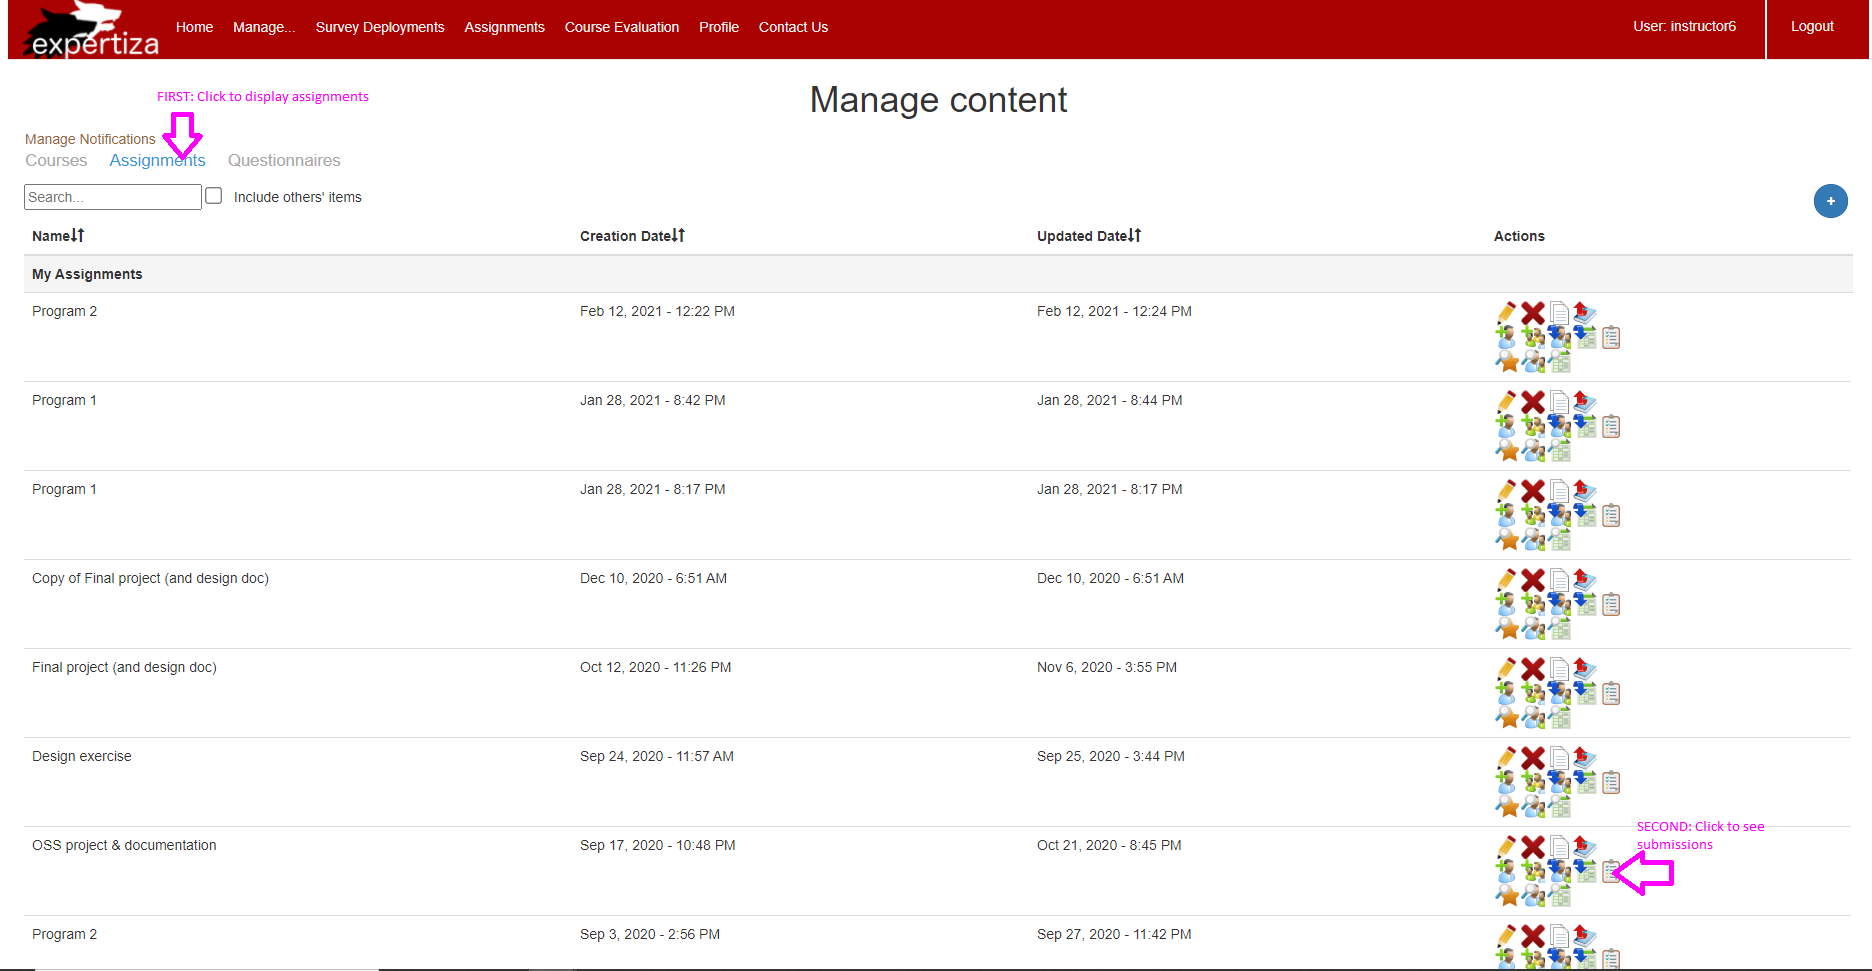
3. Both instructors and students can enter tag data. To view the instructor view, tags, and tagging heatgrid, click "Assign Grade". To impersonate a student, click the Team Member name link.
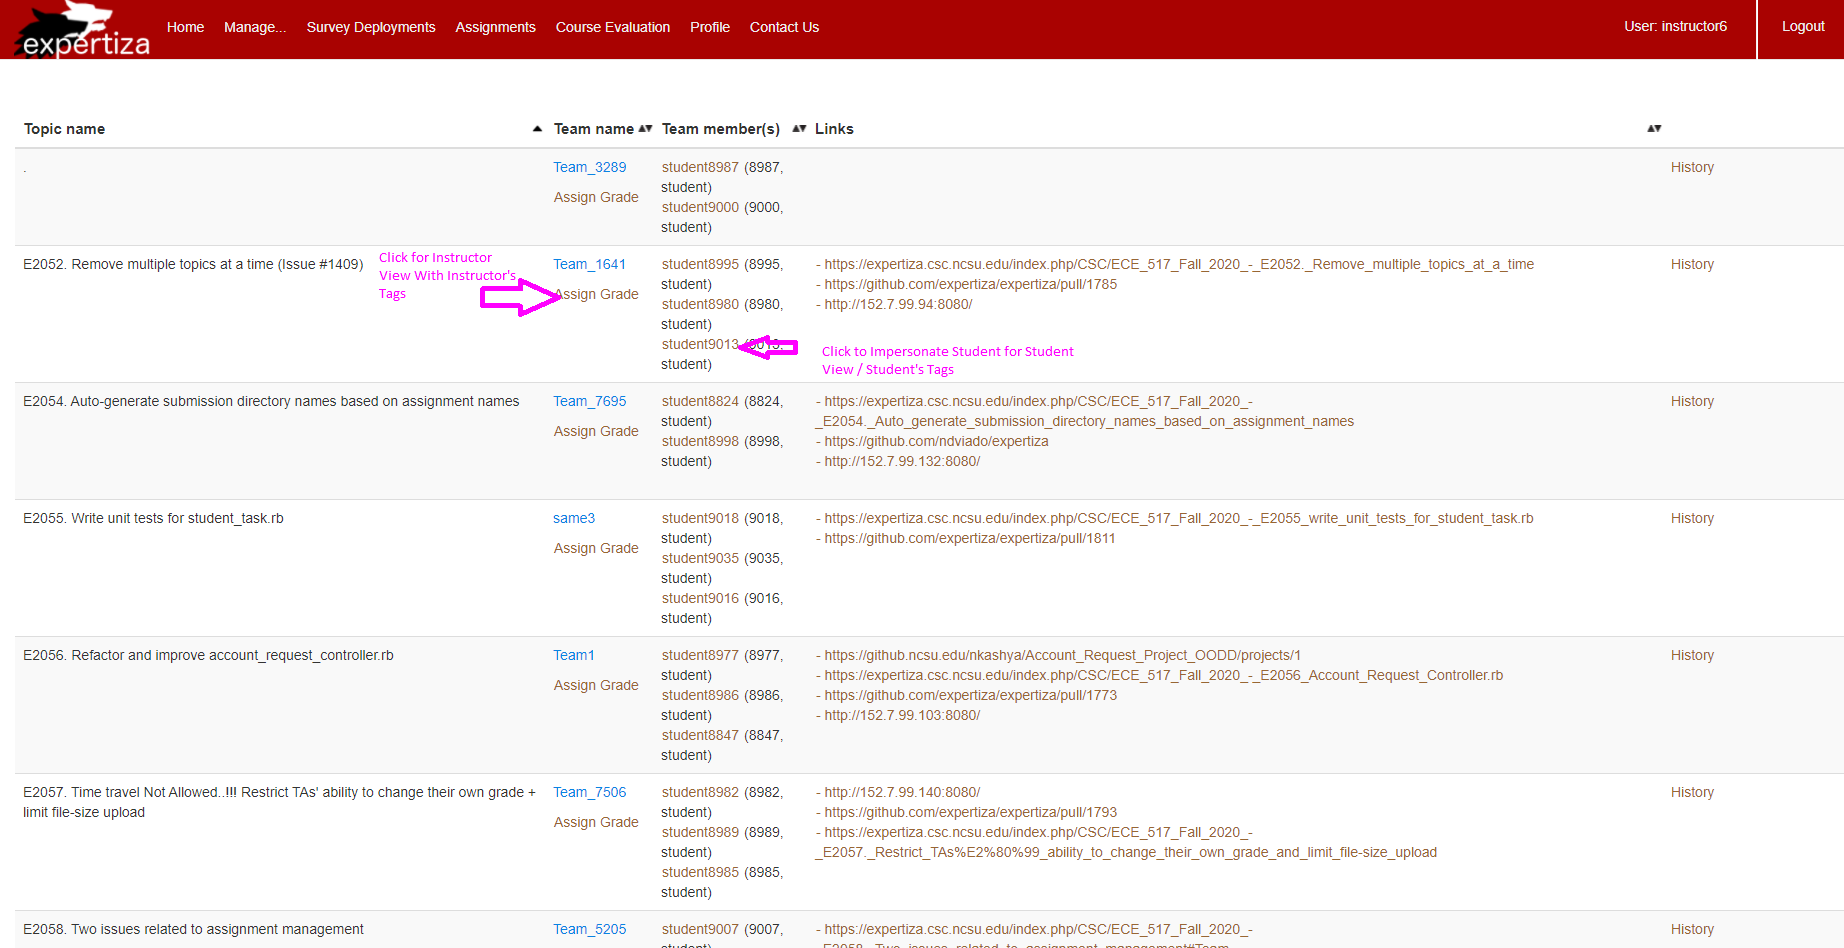
4. After impersonating a student, select an assignment. We suggest Program 2 or OSS Projects from a CSC/ECE517 section.
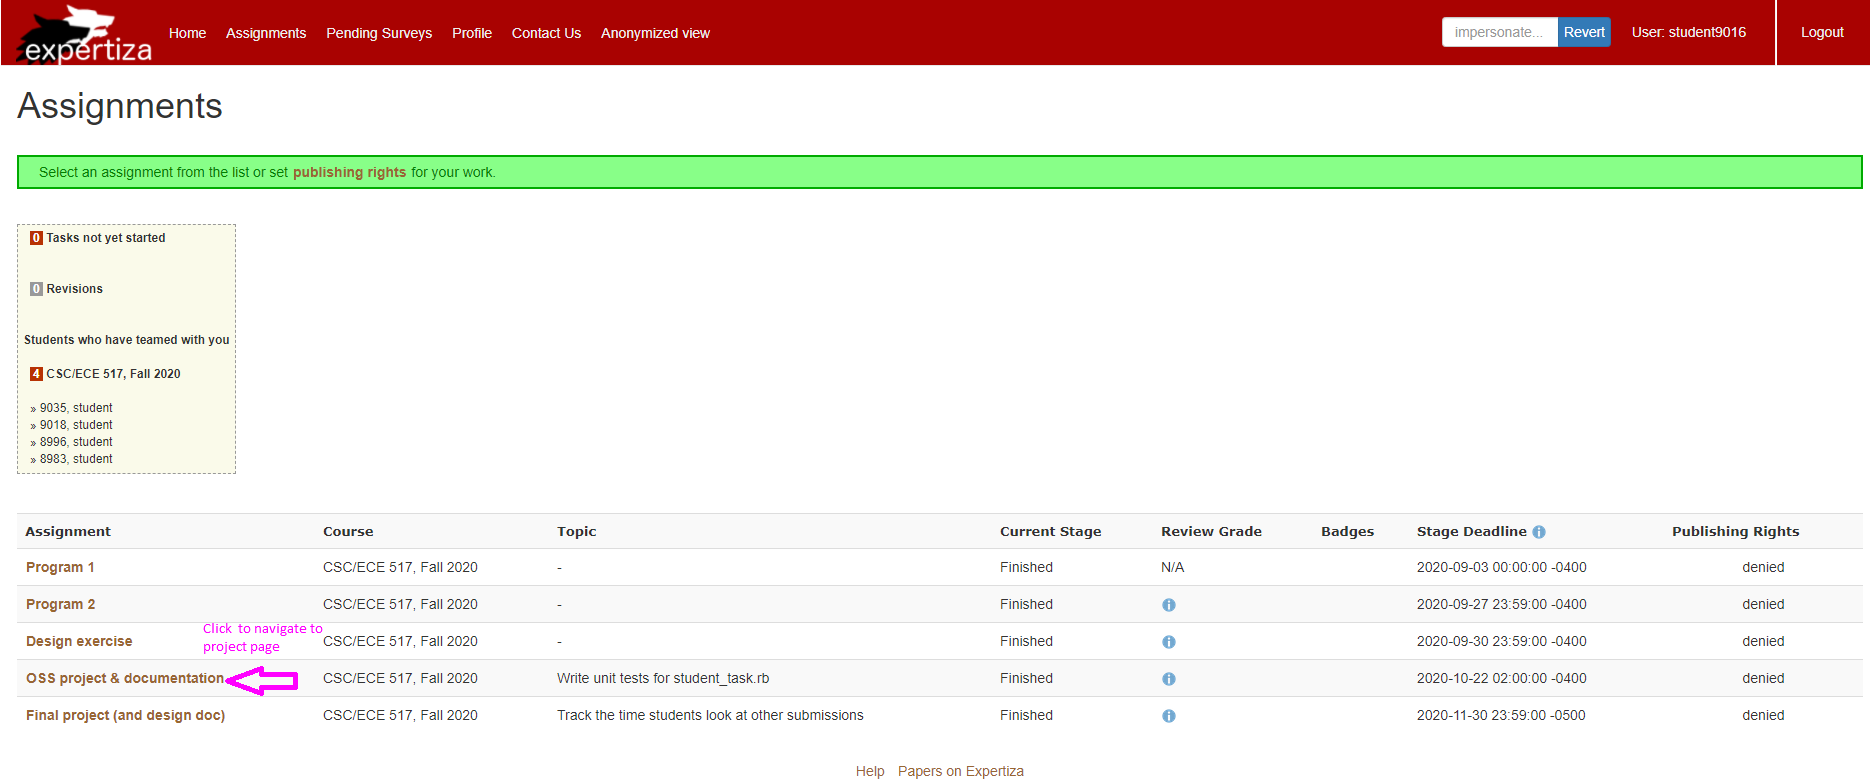
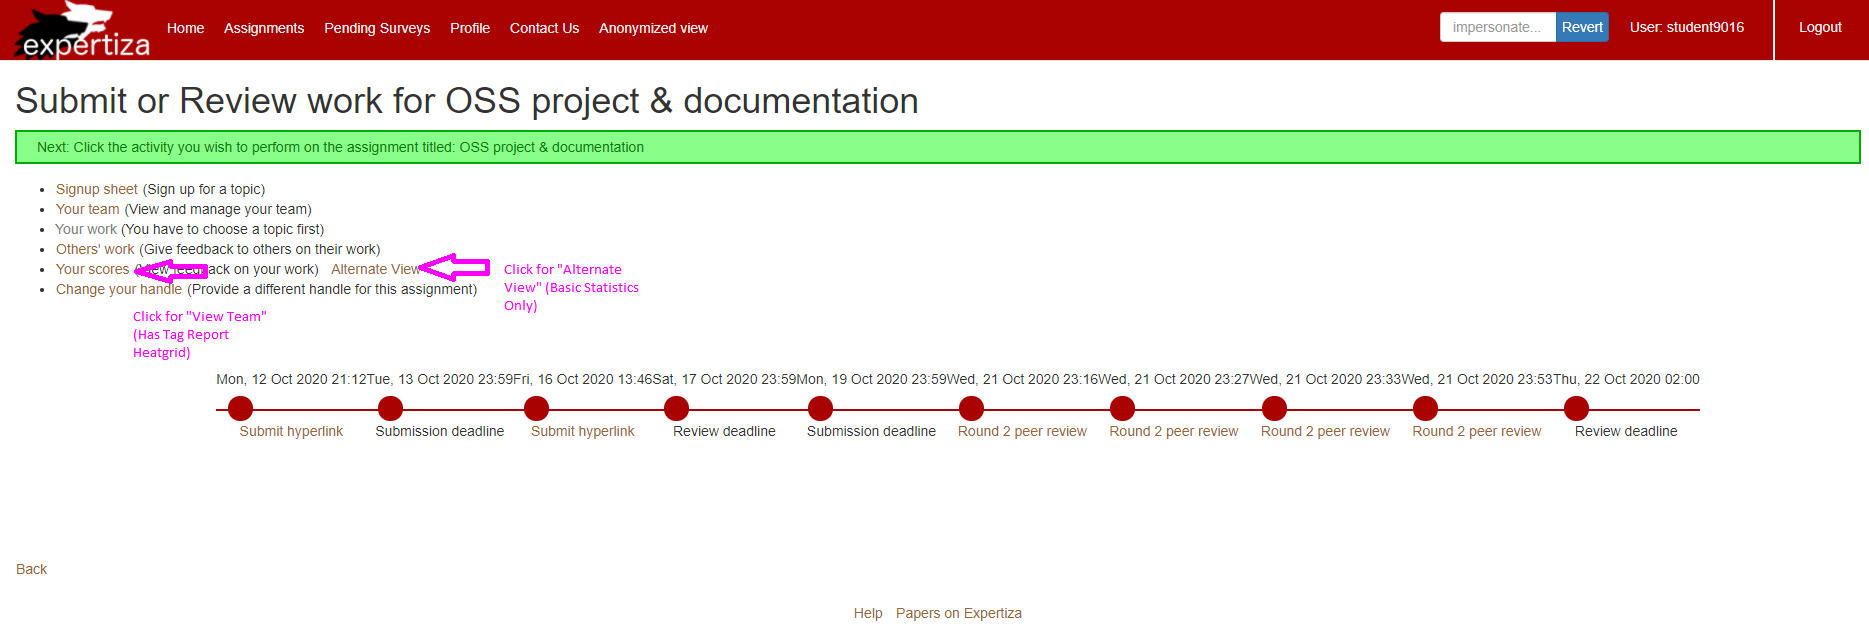
5. Click "Your Scores" to view the main View Team page which includes most of the functionality, including the tag heatgrid.
6. Items to Check:
a. On the main View Team Page, click a question row and change one or more tag prompts, to ensure the heatgrid and fraction are updated.
b. Mouseover the fraction and body of the heatgrid to view the two tooltips describing color scheme.
c. Click "Hide tags/Show Tags" to show and hide all tag-related data.
d. Click "Toggle Question List" to ensure the layout is working consistently and as expected.
e. Click the row-sorter for question or average, and change one or more tag prompts to ensure the heatgrid is still updating the correct tags

7. To view the "Alternate View", navigate back and click "Alternate View". This view should show a small counter near the top of the page with tag completion data.
You should see the following page.
8. To view a different assignment, if you have impersonated a student, in addition to using Browser-Back, you may have to click "Revert" in the impersonate dialogue.
9. We suggest now impersonating student7856 and navigating to Program 2, then Your Scores to view a series of reviews with all tags completed so you can see how the interface behaves. You will find that the tag grid is collapsed at document load when all tags are completed so it is out of the way, and can be expanded by clicking the header.
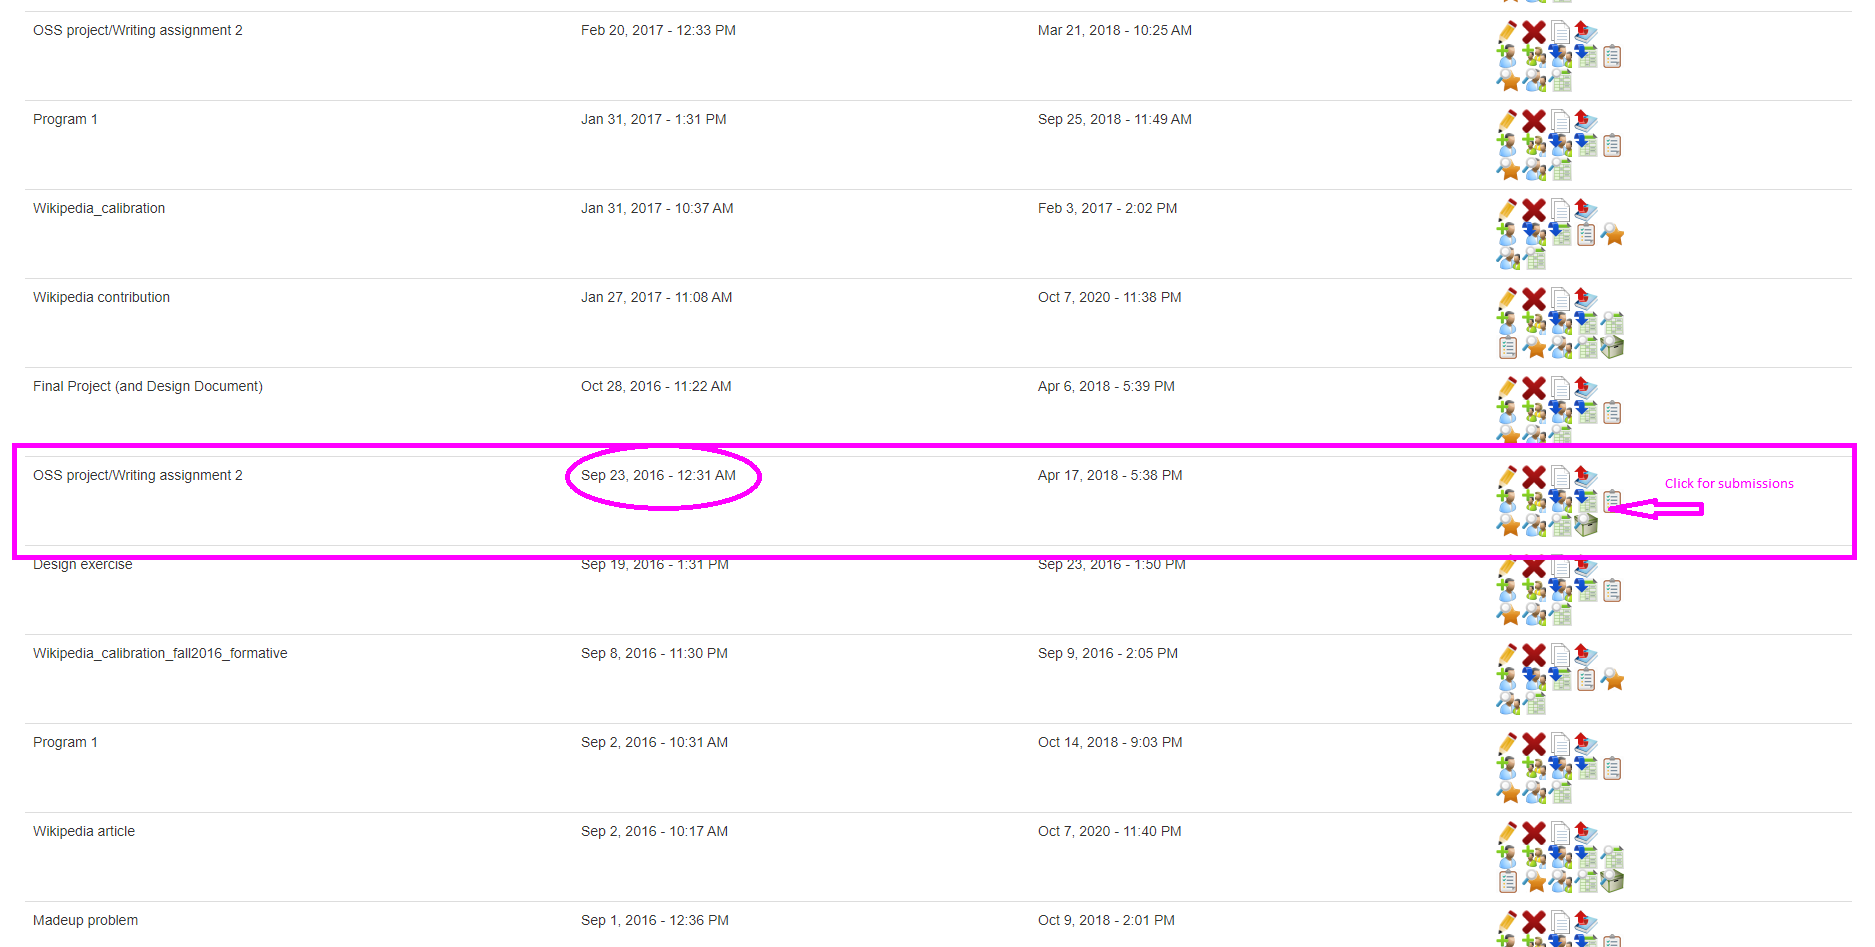
10. Finally, we suggest viewing an assignment which has reviews, but does not have a tag deployment assigned, to ensure none of the heatgrid materials related to tagging are displayed. We suggest navigating to this assignment from 2016 to test this functionality:
Additional Modifications -- Bugfix for Average Review Score on View Team
The pull request for this bugfix may be found at Github Pull Request
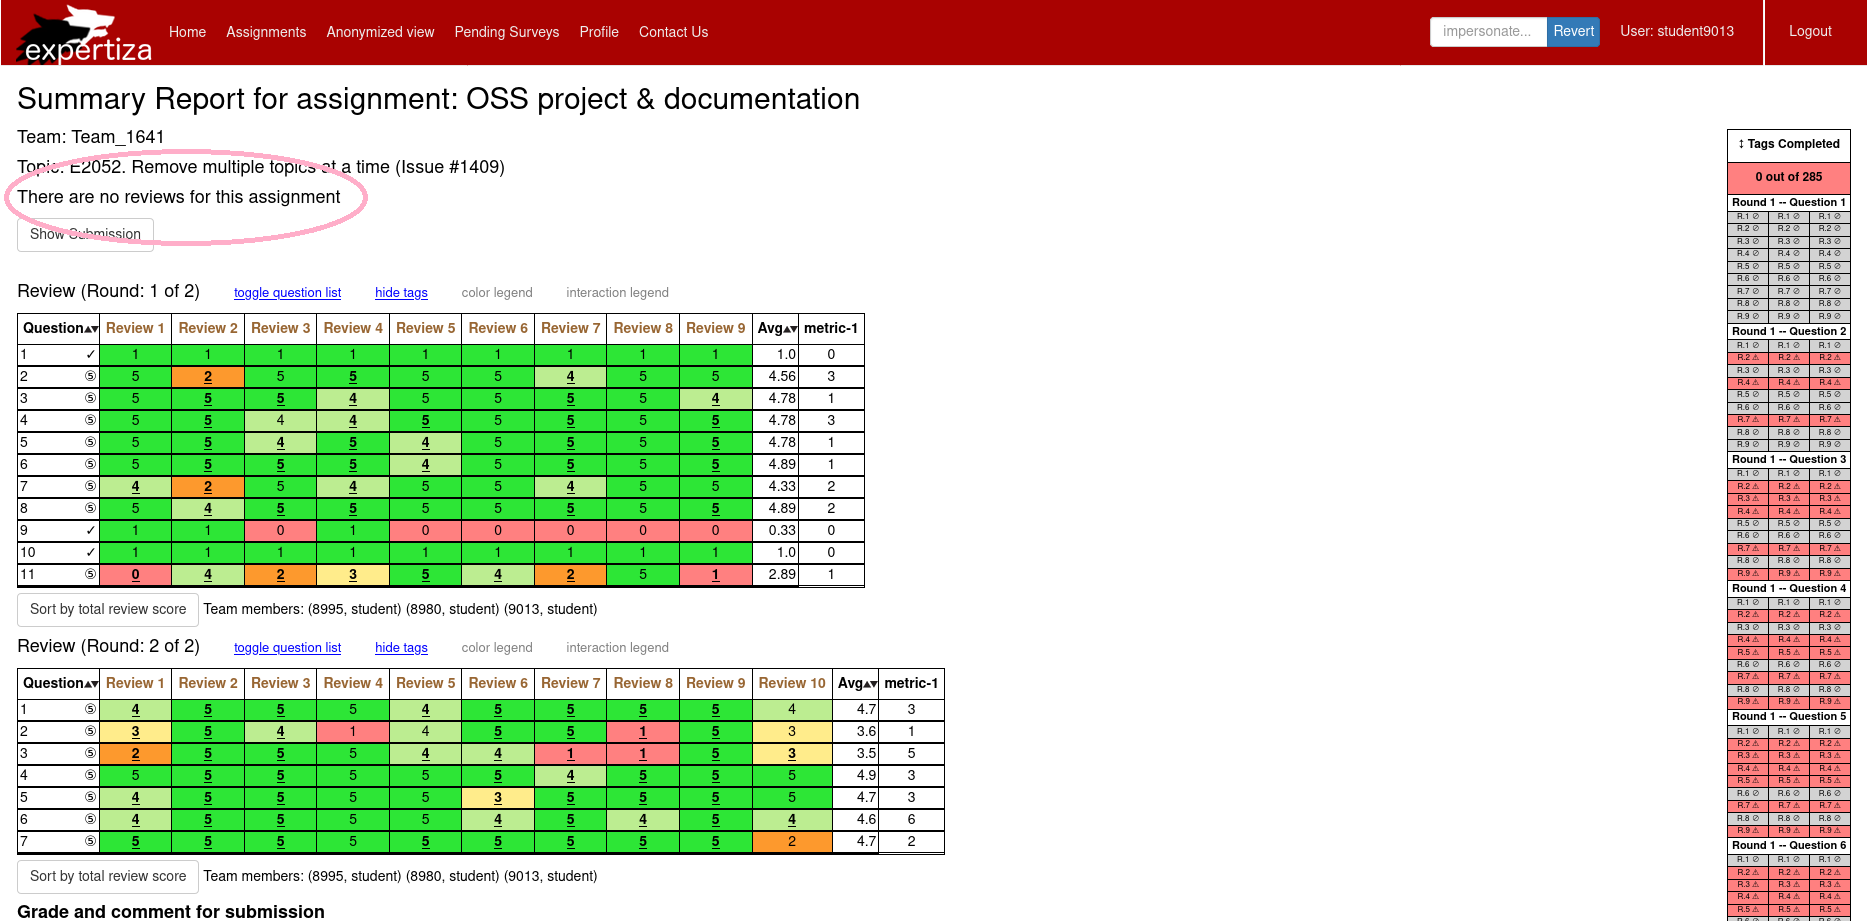
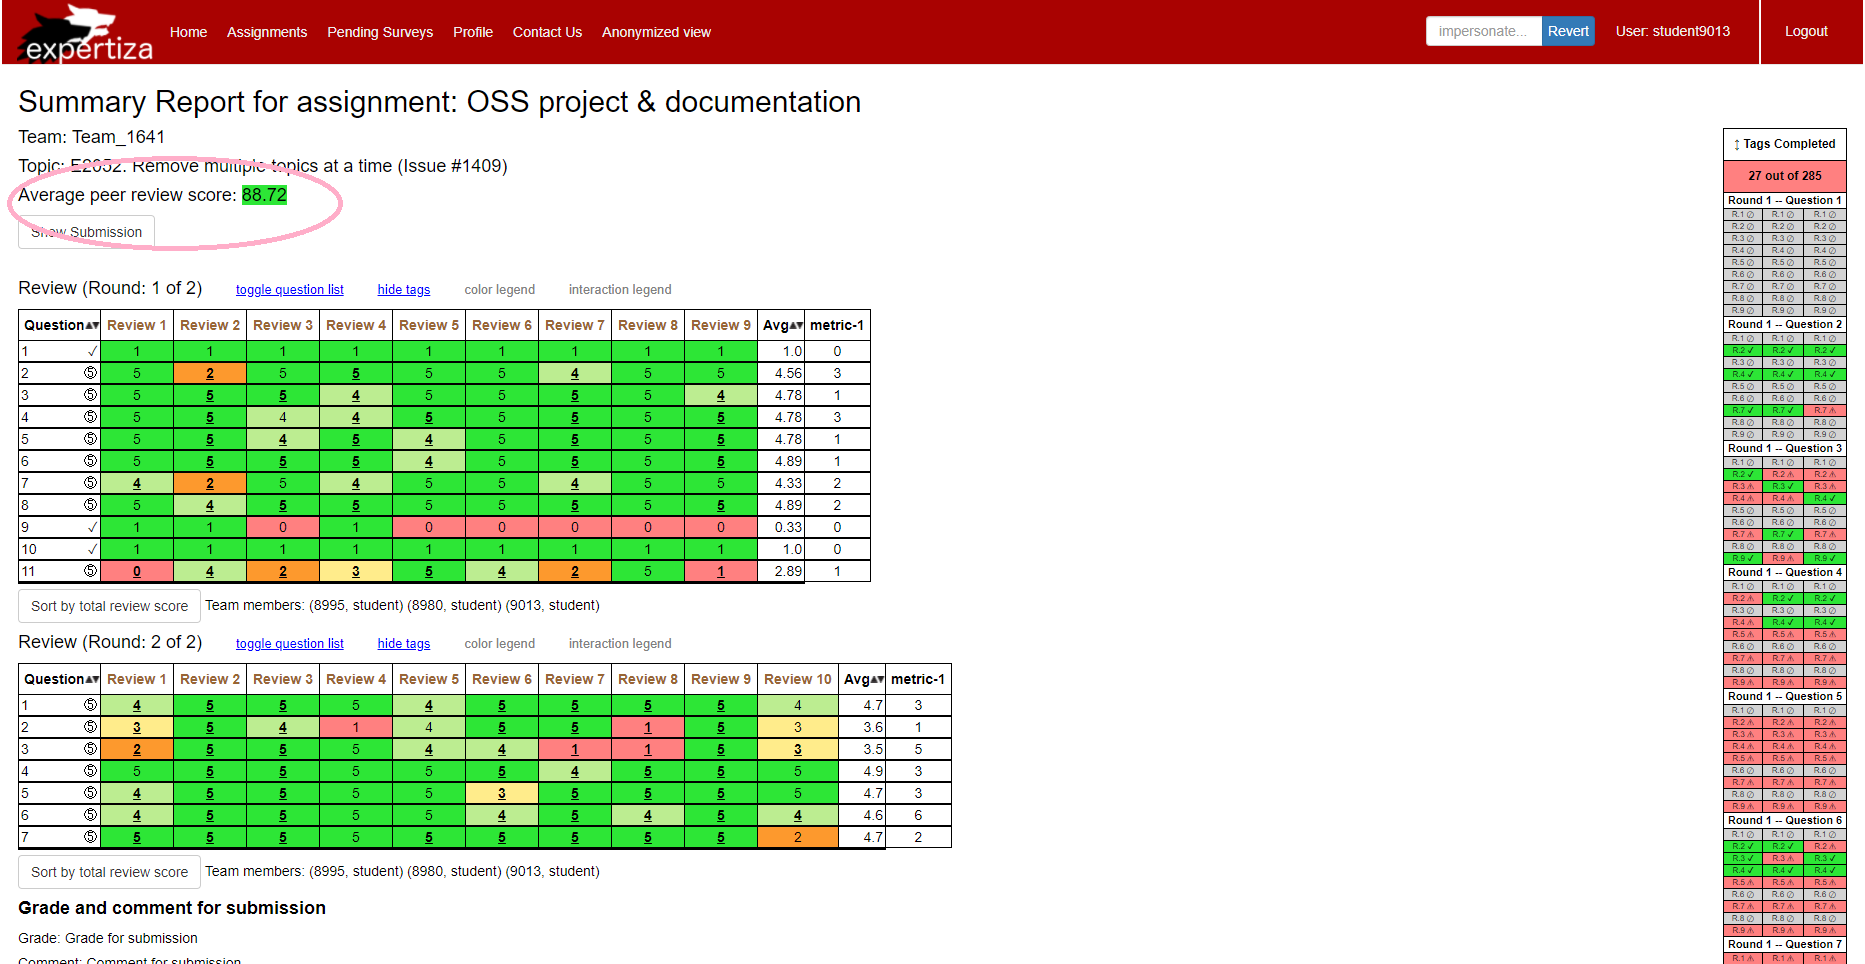
We discovered another bug where assignments with multiple rounds of reviewing did not display the average review score for the assignment. These are the screenshots of this bug before and after a patch was applied:
Screenshots
Bugfix Description
We discovered that this bug was due to a change in how scores are calculated, averaged, and stored. Average scores are computed one round of reviews at a time, and for single-round reviews, retrieved using @pscore[:review]. For multi-round reviews, the scores are stored as @pscore[:review1] and @pscore[:review2]. The existing code in view_team.html.erb was only checking for @pscore[:review], and printing "There are no reviews for this assignment" if the key, :review did not have data associated. We added a snippet to test for @pscore[:review1] and @pscore[:review2], and compute and print the average score across both reviews accordingly.
The team acknowledges that this bugfix is not ideal in implementation, but is an effective short-term fix. A more elegant solution will require significant modifications to how review score models are handled in the backend, which will affect other areas of the application, and needs to be planned more carefully than a one-shot quick fix.
The changes we made to this code are:
Important Links
E2100 Github repo - https://github.com/smdupor/expertiza
E2100 Pull Request - https://github.com/expertiza/expertiza/pull/1895
Files Changed - https://github.com/expertiza/expertiza/pull/1895/files
