CSC/ECE 517 Fall 2023 - NTX-2 Observability and Debuggability
Problem Statement
1. Devise a mechanism to export the NDB Operator (controller manager) logs to a logging system - ElasticSearch and Kibana in our case using a Filebeat sidecar.
2. We don’t want to reinvent the wheel and should focus on existing open source tools which can be used for this purpose.
3. Metrics: Add support to export basic K8s metrics which can be queried/used by tools like Prometheus later.
About Kubernetes
Kubernetes, often abbreviated as K8s, is an open-source container orchestration platform that automates the deployment, scaling, and management of containerized applications. It was originally developed by Google and is now maintained by the Cloud Native Computing Foundation (CNCF). Kubernetes provides a powerful and flexible framework for managing containers, making it easier to deploy and manage complex, distributed applications.
Key Concepts and Components of Kubernetes
Kubernetes, a powerful container orchestration system, operates seamlessly with lightweight and portable containers, such as Docker. Nodes, whether physical or virtual, serve as the machines running containerized applications within a cluster. The smallest deployable units, known as pods, contain one or more containers sharing the same network and storage. Controllers like Replica Sets and Deployments manage pod replicas for scaling and updates. Services offer a consistent method for accessing applications, providing functionalities like load balancing and service discovery. Ingress controllers handle external network access to services. ConfigMaps and Secrets manage configuration and sensitive data separately. Namespaces allow logical resource partitioning, aiding in multi-tenancy. The Kubelet agent on each node ensures containerized applications run within pods. The master node's control plane oversees the cluster, including components like the API server and etcd. The kubectl command-line tool facilitates cluster interaction. Kubernetes' extensibility and integration with diverse tools make it a popular choice for automating deployment, scaling, and operations in cloud-native environments, abstracting complexities in managing containers.
Secret
A Secret is an object containing a small quantity of sensitive data, such as a password, token, or key. This information would typically be placed in a Pod specification or a container image. The use of a Secret allows for the exclusion of confidential data from application code.
Because Secrets can be created independently of the Pods that utilize them, there is a reduced risk of the Secret (and its data) being exposed during the workflow of creating, viewing, and editing Pods. Kubernetes and applications within the cluster can also implement additional precautions when working with Secrets, like avoiding the storage of sensitive data in nonvolatile storage.
Secrets share similarities with ConfigMaps but are specifically designed to store confidential data.
Custom Resource Definition
A custom resource is an object that extends the Kubernetes API or allows us to introduce our own API into a project or a cluster. A custom resource definition (CRD) file defines our own object kinds and lets the API Server handle the entire lifecycle.
Kubernetes Operator
A Kubernetes operator is a specialized method for packaging, deploying, and managing Kubernetes applications. It leverages Kubernetes API and tooling to create, configure, and automate complex application instances on behalf of users. Operators extend Kubernetes controllers and are equipped with domain-specific knowledge to handle the entire application lifecycle. They continuously monitor and maintain applications, and their actions can range from scaling and upgrading to managing various aspects of applications, such as kernel modules.
Operators utilize custom resources (CRs) defined by custom resource definitions (CRDs) to manage applications and components. They watch CR types and translate high-level user directives into low-level actions, adhering to best practices embedded in their logic. These custom resources can be managed through kubectl and included in role-based access control policies.
Operators make it possible to automate tasks that go beyond Kubernetes' built-in automation features, aligning with DevOps and site reliability engineering (SRE) practices. They encapsulate human operational knowledge into software, eliminating manual tasks and are typically created by those with expertise in the specific application's business logic.
The Operator Framework is a set of open-source tools that streamline operator development, offering an Operator SDK for building operators without deep Kubernetes API knowledge, Operator Lifecycle Management for overseeing operator installation and management, and Operator Metering for usage reporting in specialized services.
In summary, Kubernetes operators simplify the management of complex, stateful applications by encoding domain-specific knowledge into Kubernetes extensions, making the processes scalable, repeatable, and standardized. They are valuable for both application developers and infrastructure engineers, streamlining application deployment and management while reducing support burdens.
Nutanix Database Service
Introduction
Nutanix is a hybrid multicloud DBaaS for Microsoft SQL Server, Oracle, PostgreSQL, MongoDB, and MySQL. It efficiently and securely manages hundreds to thousands of databases along with powerful automation for provisioning, scaling, patching, protection, and cloning of database instances. NDB helps customers deliver database as a service (DBaaS) and an easy-to-use self-service database experience on-premises and public cloud to their developers for both new and existing databases.
Benefits
Simplified Database Management and Accelerated Software Development Across Multiple Clouds:
1. Automate laborious database administrative tasks without sacrificing control or flexibility.
2. Streamline database provisioning to make it simple, rapid, and secure, thereby supporting agile application development.
Enhanced Security and Consistency in Database Operations:
1. Automate database administration tasks to ensure the consistent application of operational and security best practices across your entire database fleet.
Expedited Software Development:
1. Empower developers to effortlessly deploy databases with minimal effort, directly from their development environments, facilitating agile software development.
Increased Focus for DBAs on High-Value Activities:
1. By automating routine administrative tasks, Database Administrators (DBAs) can allocate more time to activities of higher value, such as optimizing database performance and delivering new features to developers.
Preserved Control and Maintenance of Database Standards:
1. Select the appropriate operating systems, database versions, and extensions to meet specific application and compliance requirements while retaining control over your database environment.
Features
1. Database lifecycle management: Manage the entire database lifecycle, from provisioning and scaling to patching and cloning, for all your SQL Server, Oracle, PostgreSQL, MySQL, and MongoDB databases.
2. Database management at scale: Manage hundreds to thousands of databases across on-premises, one or more public clouds, and colocation facilities, all from a single API and console.
3. Self-service database provisioning: Enable self-service provisioning for both dev/test and production use via API integration with popular infrastructure management and development tools like Kubernetes and ServiceNow.
4. Database protection and Compliance: Quickly roll out security patches across some or all your databases and restrict access to databases with role-based access controls to ensure compliance.
5. High Availability: Nutanix DBaaS typically includes high availability features to minimize database downtime and ensure continuous access to data.
NDB Architecture
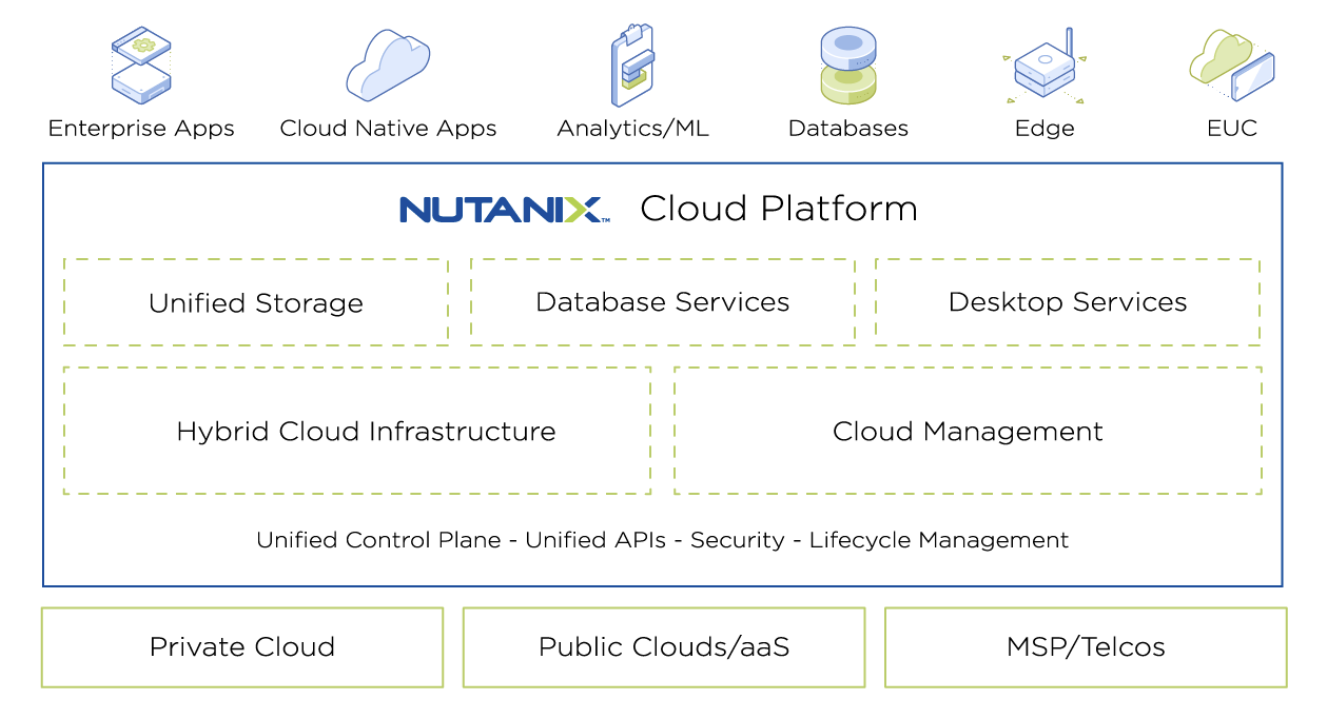
The Nutanix Cloud Platform combines hybrid cloud infrastructure, multicloud management, unified storage, database services, and desktop services to facilitate the operation of any application or workload, regardless of location.
Nutanix provides a comprehensive cloud infrastructure solution, featuring hyper-converged architecture for simplified compute and storage management. This encompasses networking, disaster recovery, security, AI-driven edge computing, private cloud deployment, and MSP services, promoting scalability, high availability, security, and innovation across various IT needs.
Nutanix Cloud Management streamlines the entire application lifecycle with seamless deployment, scaling, monitoring, and optimization, enabling self-service infrastructure provisioning, cost efficiency, and AI-driven insights for agile, secure, and cost-effective cloud management.
Nutanix Unified Storage offers software-defined, scalable storage solutions that cater to enterprise NAS and object workloads for unstructured data, structured data with block storage, and backup storage. It replaces traditional independent storage services and offering a unified control plane.
Nutanix Database Service (NDB) can easily manage databases across multiple locations both on-premises and in the cloud with Nutanix Cloud Clusters (NC2) on Amazon Web Services (AWS). In a multi cluster NDB environment, the NDB management plane requires one NDB management agent VM in each Nutanix cluster it manages.
Logging Architecture
The logs are very helpful for tracking cluster activity and troubleshooting issues. The majority of contemporary apps contain some sort of logging system. Container engines are also built to accommodate logging. Writing to standard error and output streams is the most popular and simplest logging technique for containerized applications.
However, most of the time a complete logging solution requires more than the basic capability offered by a container engine or runtime. For instance, in the event that a node fails, a pod is removed, or a container crashes, we might wish to see the logs for our application.
Logs in a cluster should be stored and managed independently of nodes, pods, or containers. We refer to this idea as cluster-level logging. Cluster-level logging architectures require a separate backend to store, analyze, and query logs.
Cluster-level logging architectures
While Kubernetes does not provide a native solution for cluster-level logging, there are several common approaches we can consider. Here are some options:
1. Push logs directly to a backend from within an application.
2. Use a node-level logging agent that runs on every node.
3. Include a dedicated sidecar container for logging in an application pod.
1. Exposing logs directly from the application
Cluster-logging that exposes or pushes logs directly from every application is outside the scope of our considerations. The main reason driving the eviction of this option is the Single-responsibility principle. Modifying the application code to handle logging to a backend store violates this principle. It also hampers scalability.
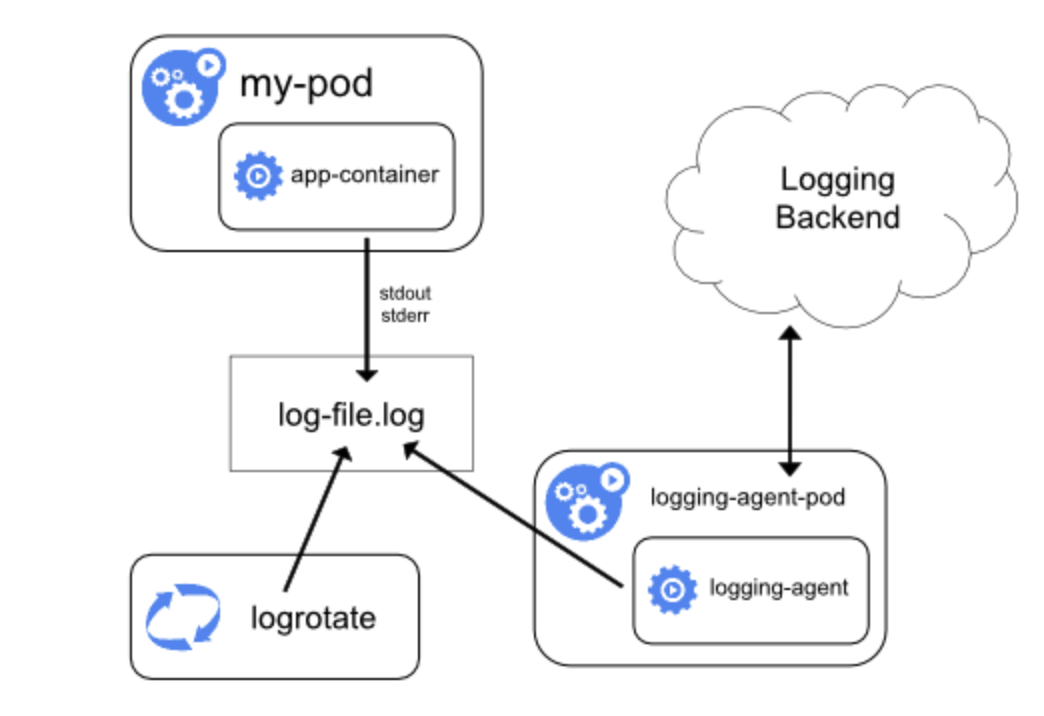
2. Using a node logging agent
By installing a node-level logging agent on every node, we can implement cluster-level logging. A specialized tool called a logging agent is used to push or expose logs to a backend. Typically, a container with access to a directory containing log files from each application container on that node serves as the logging agent.
It is advised to run the logging agent as a DaemonSet since it needs to operate on each node. Node-level logging doesn't require any modifications to the node's running applications and only generates one agent per node.
Containers write to stdout and stderr, but with no agreed format. These logs are gathered by a node-level agent and forwarded for aggregation.
3. Using a sidecar container with the logging agent
What is a sidecar?
A Sidecar is a term used to refer to containers running on the same pod as the application container. Due to the way pods work, the sidecar container has access to the same volume and share the same network interface with the other container. A sidecar container can send the logs either by pulling them from the application (like through an API endpoint designed for that purpose) or by scanning and parsing the log files that the application stores (remember, they are sharing the same storage).
There are 2 ways in which a sidecar container can be used:
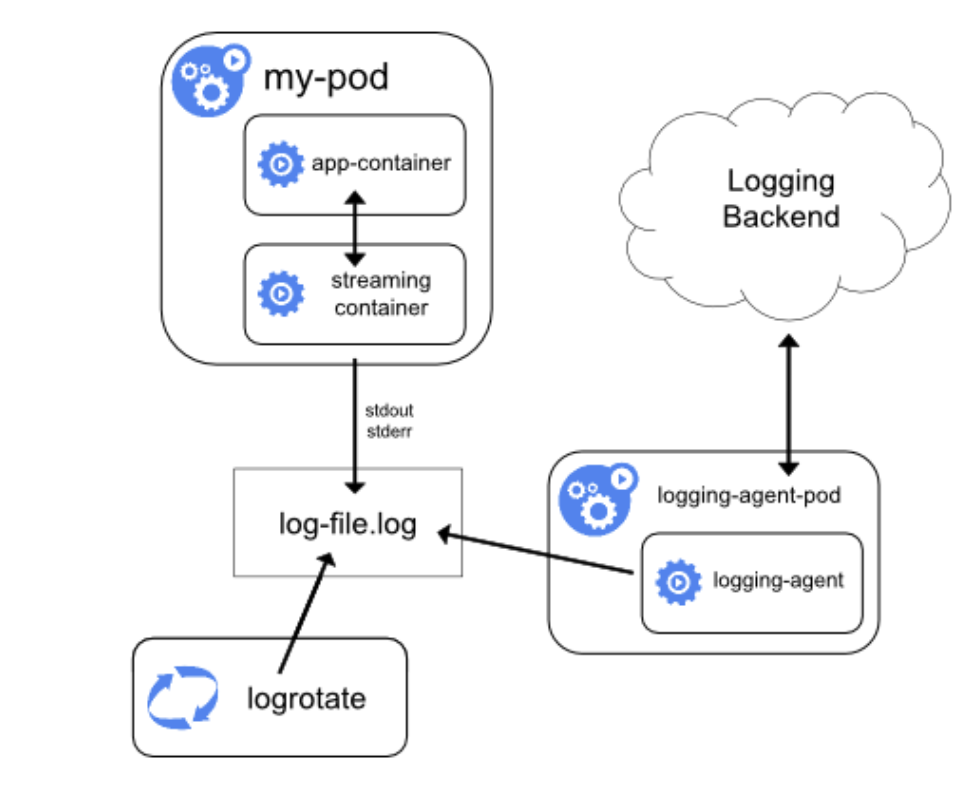
a. The sidecar container streams application logs to its own stdout.
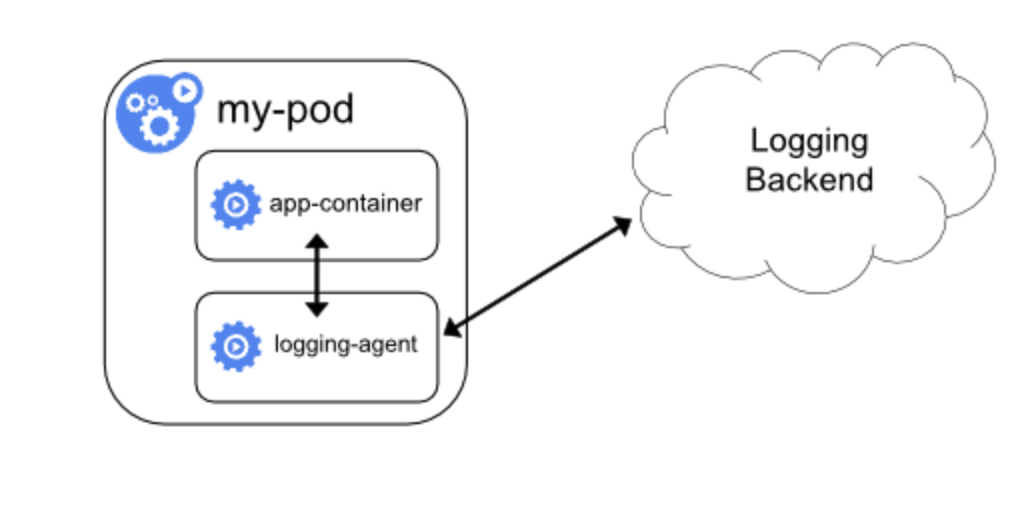
b.The sidecar container runs a logging agent, which is configured to pick up logs from an application container.
3.a. Streaming sidecar container
This approach allows us to separate several log streams from different parts of our application, some of which can lack support for writing to stdout or stderr. The logic behind redirecting logs is minimal, so it's not a significant overhead. But we haven’t found the benefit of using this approach as it increases complexity by adding more interaction surfaces.
3.b. Sidecar container with a logging agent
We can create a sidecar container with a different logging agent that we have configured specifically to run with our application if the node-level logging agent isn't flexible enough.
When a logging agent is used in a sidecar container, a lot of resources may be used. Furthermore, since those logs are independent of the kubelet, we will not be able to access them using kubectl logs.
Which one to choose?
Here's a table outlining the pros and cons of the four different logging architectures discussed:
| Logging Architecture | Pros | Cons |
|---|---|---|
| Exposing Logs Directly from Application | 1. Allow us to have fine-grained control over the log generation and transmission process.
2. Achieves complex log handling for very specific logging needs
|
1. Logs may not be centralized and may be scattered across nodes.
2. No native support for log collection and analysis. 3. Complex and custom implementation required for log handling. 4. Not recommended by Kubernetes. |
| Node-level Logging Agent | 1. Centralized log collection from all nodes.
2. Allows for easy log aggregation and analysis. 3.Minimal changes to applications running on nodes. |
1. Requires a logging agent to run on every node, which may consume additional resources.
2. Additional overhead for log forwarding and aggregation. 3. Logs may be in different formats, requiring parsing for analysis.
|
| Sidecar Container with Streaming | 1. Separation of different log streams for applications.
2. Leverages kubelet and builtin tools for log access. 3. Simplifies log rotation and retention policies. |
1. Potential increase in storage usage if applications write to files.
2. Not recommended for apps with low CPU and memory usage. 3. May not be suitable for applications with diverse log formats. |
| Sidecar Container with Logging Agent | 1. Provides flexibility for custom log collection and processing.
2. Tailored log collection for specific applications. 3. Enables advanced log processing and routing options. |
1. Increased resource consumption due to additional container.
2. Logs in sidecar containers are not accessible using kubectl logs.
|
Phase 2
Writing logs to a file
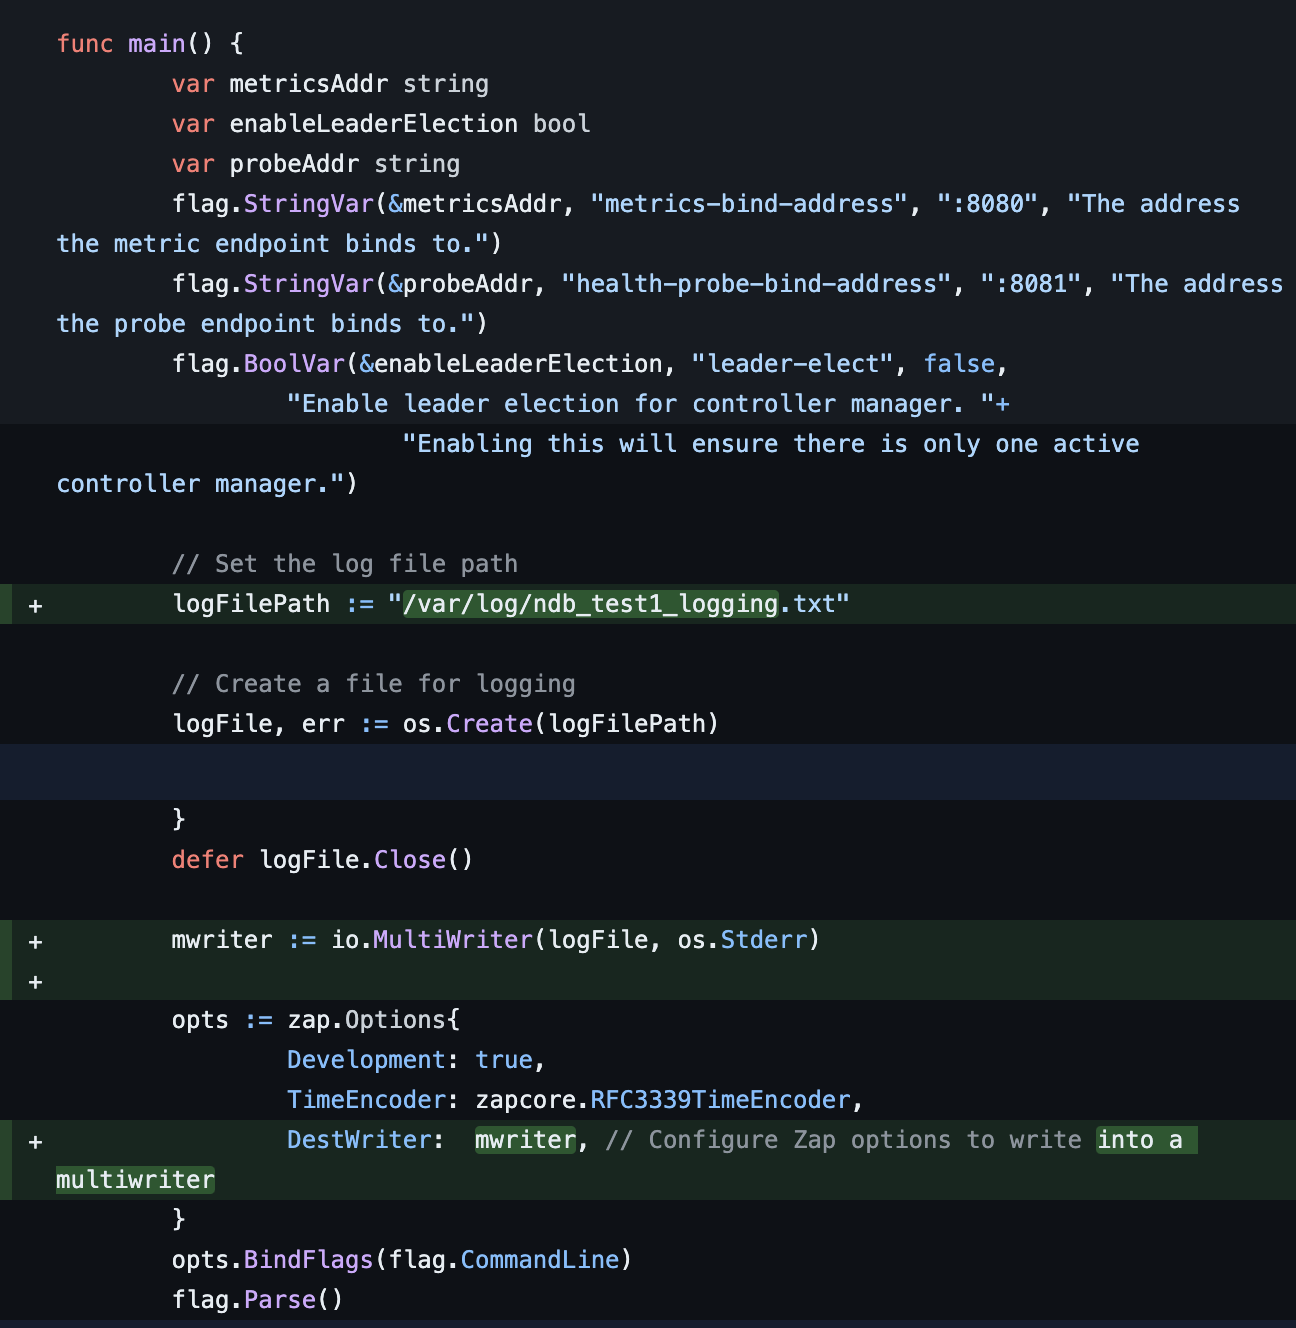
We went ahead with the approach to write the log statements generated to a file. The code changes were made in main.go file of the repository. The logs have been written in a file called ndb-operator.log, which is in the /var/log directory. We have used MultiWriter to write to a file and the console.
Here are the code changes:
Logging File
The log file contains all the logs that are generated by the logr.Logger statements in the code. They include the error and information logs. The logs which are saved in the ndb-operator.log file are:
2023-11-15T22:32:37-05:00 INFO controller-runtime.metrics Metrics server is starting to listen {"addr": ":8080"}
2023-11-15T22:32:37-05:00 INFO setup starting manager
2023-11-15T22:32:37-05:00 INFO starting server {"path": "/metrics", "kind": "metrics", "addr": "[::]:8080"}
2023-11-15T22:32:37-05:00 INFO Starting server {"kind": "health probe", "addr": "[::]:8081"}
2023-11-15T22:32:37-05:00 INFO Starting EventSource {"controller": "database", "controllerGroup": "ndb.nutanix.com", "controllerKind": "Database", "source": "kind source: *v1alpha1.Database"}
2023-11-15T22:32:37-05:00 INFO Starting EventSource {"controller": "database", "controllerGroup": "ndb.nutanix.com", "controllerKind": "Database", "source": "kind source: *v1.Service"}
2023-11-15T22:32:37-05:00 INFO Starting EventSource {"controller": "ndbserver", "controllerGroup": "ndb.nutanix.com", "controllerKind": "NDBServer", "source": "kind source: *v1alpha1.NDBServer"}
2023-11-15T22:32:37-05:00 INFO Starting EventSource {"controller": "database", "controllerGroup": "ndb.nutanix.com", "controllerKind": "Database", "source": "kind source: *v1.Endpoints"}
2023-11-15T22:32:37-05:00 INFO Starting Controller {"controller": "database", "controllerGroup": "ndb.nutanix.com", "controllerKind": "Database"}
2023-11-15T22:32:37-05:00 INFO Starting Controller {"controller": "ndbserver", "controllerGroup": "ndb.nutanix.com", "controllerKind": "NDBServer"}
2023-11-15T22:32:37-05:00 INFO Starting workers {"controller": "ndbserver", "controllerGroup": "ndb.nutanix.com", "controllerKind": "NDBServer", "worker count": 1}
2023-11-15T22:32:37-05:00 INFO Starting workers {"controller": "database", "controllerGroup": "ndb.nutanix.com", "controllerKind": "Database", "worker count": 1}
2023-11-15T22:32:52-05:00 INFO Stopping and waiting for non leader election runnables
2023-11-15T22:32:52-05:00 INFO shutting down server {"path": "/metrics", "kind": "metrics", "addr": "[::]:8080"}
2023-11-15T22:32:52-05:00 INFO Stopping and waiting for leader election runnables
2023-11-15T22:32:52-05:00 INFO Shutdown signal received, waiting for all workers to finish {"controller": "database", "controllerGroup": "ndb.nutanix.com", "controllerKind": "Database"}
2023-11-15T22:32:52-05:00 INFO Shutdown signal received, waiting for all workers to finish {"controller": "ndbserver", "controllerGroup": "ndb.nutanix.com", "controllerKind": "NDBServer"}
2023-11-15T22:32:52-05:00 INFO All workers finished {"controller": "database", "controllerGroup": "ndb.nutanix.com", "controllerKind": "Database"}
2023-11-15T22:32:52-05:00 INFO All workers finished {"controller": "ndbserver", "controllerGroup": "ndb.nutanix.com", "controllerKind": "NDBServer"}
2023-11-15T22:32:52-05:00 INFO Stopping and waiting for caches
2023-11-15T22:32:52-05:00 INFO Stopping and waiting for webhooks
2023-11-15T22:32:52-05:00 INFO Wait completed, proceeding to shutdown the manager
Implementation of file log rotation
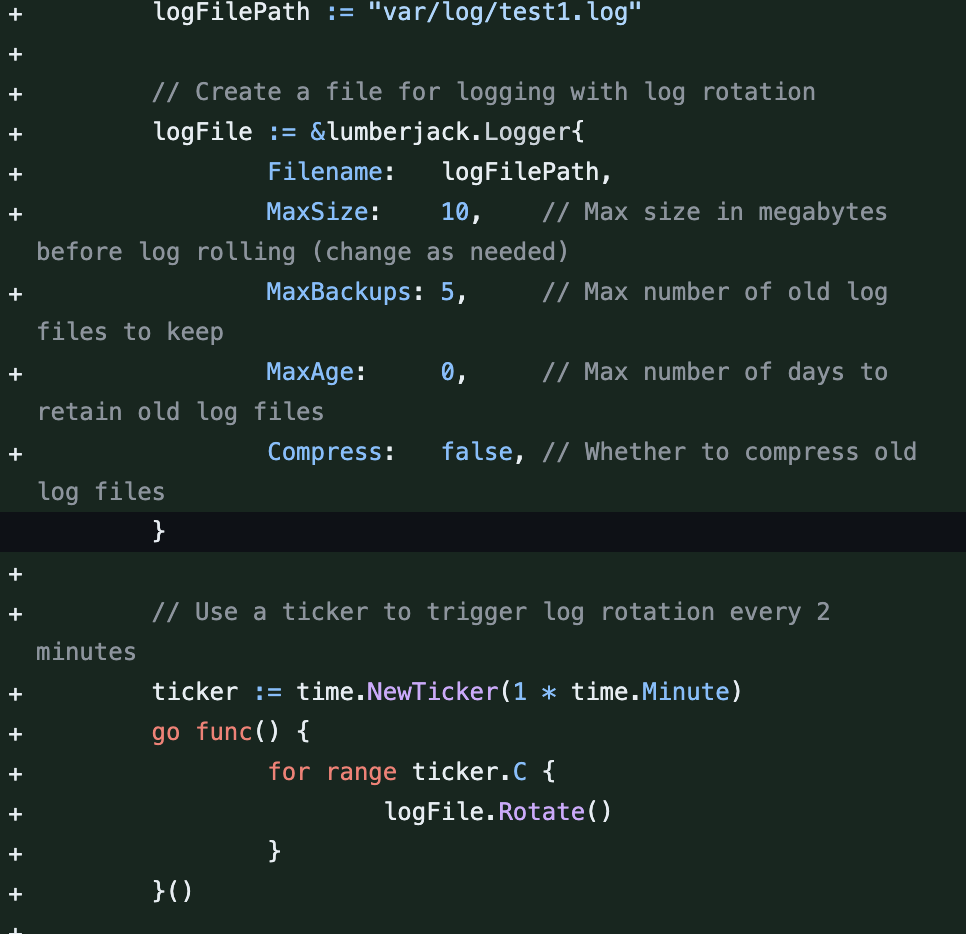
Given that web backends operate over extended durations, it is undesirable for log files to continually expand without bounds. To address this concern, log rotation provides a solution by generating a new log file either when the existing one reaches a specified size threshold or at specific intervals. In our case, for the purpose of testing we have implemented log rotation after every 1 minute. These parameters are easily configurable and can be changed according to the user's needs.
To implement log rotation we have used the lumberjack package, which is a log rolling package for Go. This package allows us to perform log rotation based on size and time. We have also used a ticker to trigger log rotation every minute.
Below are the code changes made for file log rotation:
Test Plan
I. Default Logging Behavior:
Objective: Confirm that logs are printed to the console by default.
Steps:
1. Run the program without specifying the log file.
2. Observe the logs printed to the console during the program's execution.
II. Log File Creation:
Objective: Confirm that the log file is created.
Steps:
1. Run the program with the log file path specified (/var/log/ndb-operator.log).
2. Check the specified log file path to ensure that the log file is created.
III. Log Entries in Console & File:
Objective: Verify that logs are printed to the console and specified log file.
Steps:
1. Run the program with the log file path specified.
2. Observe the logs printed to the console during the program's execution.
3. Open the specified log file (/var/log/ndb-operator.log) and check for log entries
4. Confirm that the log entries in the console match those in the log file.
IV. Log Entries through SideCar container:
Objective: Ensure that the sidecar container streams application logs to the configured output.
Steps:
1. Verify that the sidecar container is configured to receive logs from the main application container.
2. Start the service with both the main application container and the sidecar container.
3. Inspect the logs of the sidecar container.
4. Confirm the log from the main application container matches the sidecar’s log files.
V. Logging Levels: Debug, Info, Error:
Objective: Confirm that logs at different levels are printed to both console and file.
Steps:
1. Intentionally generate logs at different levels (Debug, Info, Error).
2. Verify that logs of each level are present in both the console and the log file.
VI. Custom Logging Statements:
Objective: Ensure that custom log statements are captured in both outputs.
Steps:
1. Introduce custom log statements in your code.
2. Verify that these custom log statements are correctly logged to both the console and the log file and also include timestamps.
VII. Error Scenarios:
Objective: Confirm that errors are logged to both outputs.
Steps:
1. Intentionally induce errors in your code.
2. Verify that error logs are generated and present in both the console and the log file.
VIII. Cleanup:
Objective: Ensure that the log files created during testing are cleaned up.
Steps:
1. Delete any log files created during testing.
2. Confirm that the cleanup process does not result in errors.
Filebeat Sidecar, Elasticsearch and Kibana
Elasticsearch is the distributed search and analytics engine at the heart of the Elastic Stack. Filebeat facilitates collecting, aggregating, and enriching data and storing it in Elasticsearch. Kibana enables users to interactively explore, visualize, and share insights into data and manage and monitor the stack.
Logging Architecture
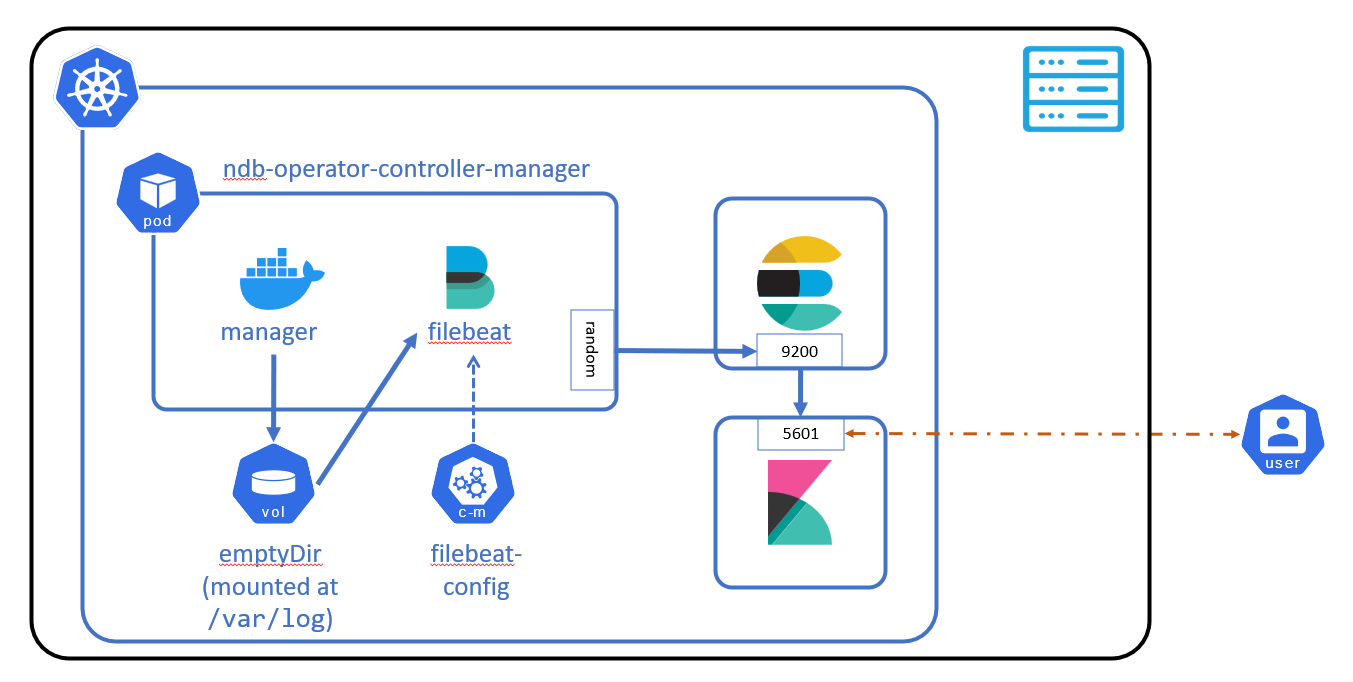
1. The ndb-operator-controller-manager pod has two containers, Manager and Filebeat.
2. The emptyDir of type volume has been mounted on /var/log in filebeat as well as manager container.
3. The filebeat has been configured in a way that the logs are exported to ElasticSearch database instance (port number used -9200) which is hostel locally in our cluster.
4. The logs are shared between ElasticSearch database instance and Kibana which is the visualization tool for our logs.
Exporting logs to Elasticsearch and Kibana
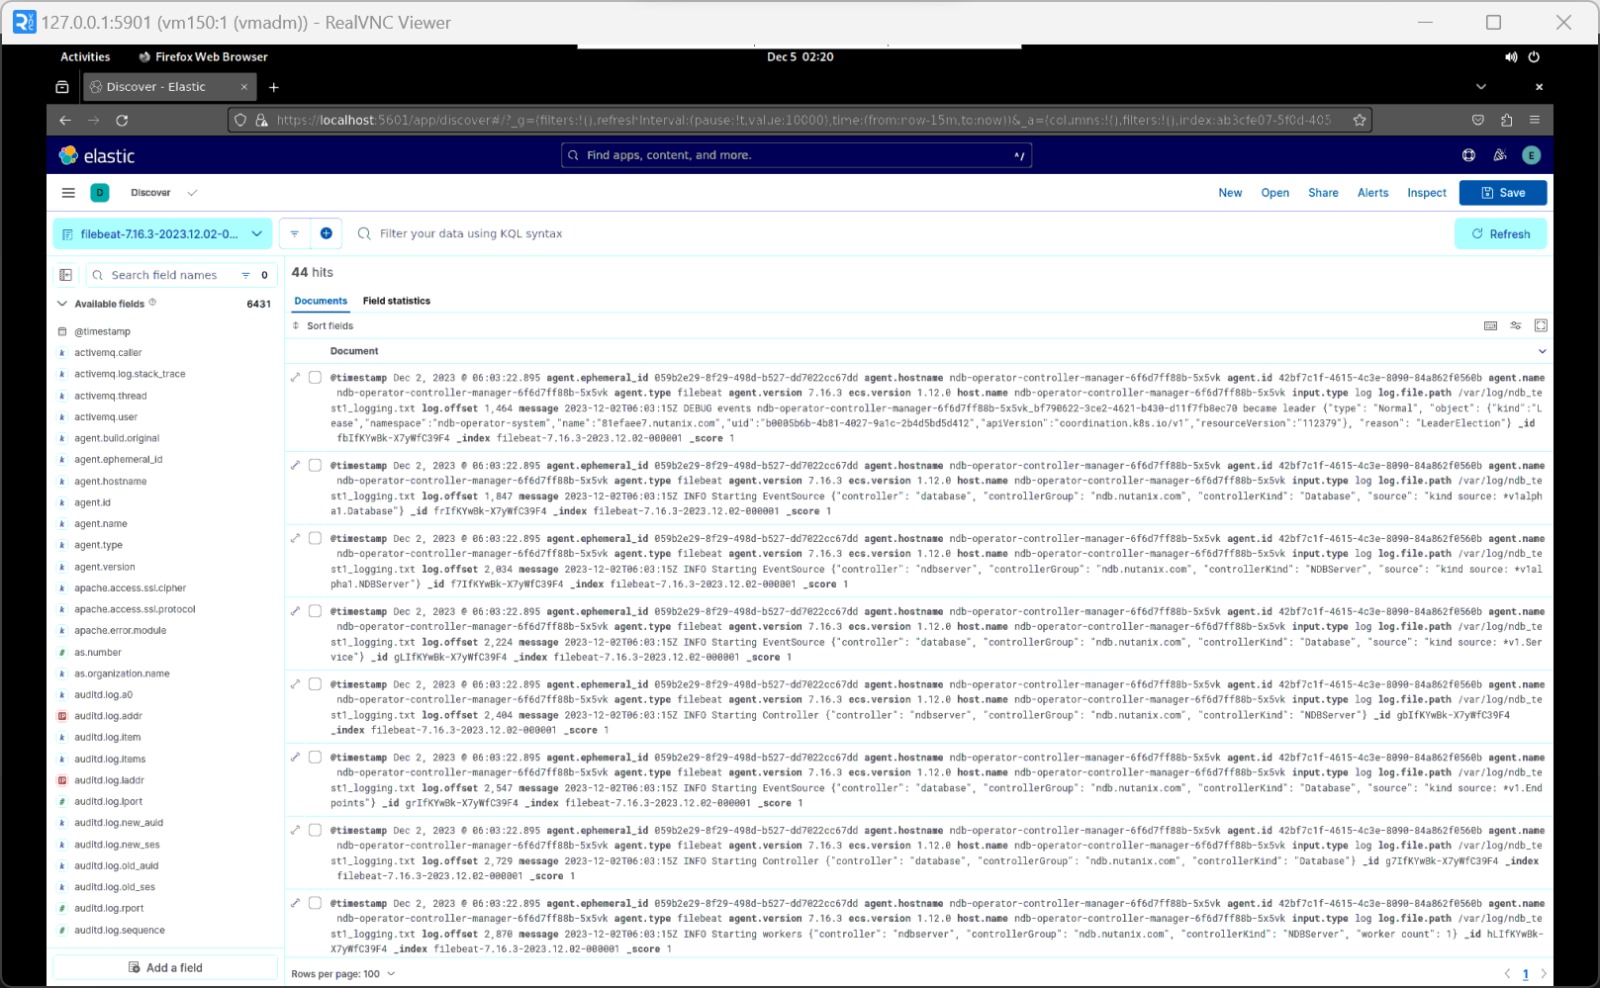
Elasticsearch is hosted on the port 9200. Kibana is hosted on port 5601.Below is a screenshot of the logs exported to Kibana, which is a visualizing tool.
References
Nutanix website[1]
Kubernetes website for logging documentation[2]
Relevant Links
Github repository: https://github.com/ksjavali/ndb-operator
Team
Mentor
Nandini Mundra
Student Team
Kritika Javali (ksjavali@ncsu.edu)
Rahul Rajpurohit (rrajpu@ncsu.edu)
Sri Haritha Chalichalam (schalic@ncsu.edu)
