CSC/ECE 517 Fall 2019 - E1993 Track Time Between Successive Tag Assignments
Introduction
The Expertiza project takes advantage of peer-review among students to allow them to learn from each other. Tracking the time that a student spends on each submitted resources is meaningful to instructors to study and improve the teaching experience. Unfortunately, most peer assessment systems do not manage the content of students’ submission within the systems. They usually allow the authors submit external links to the submission (e.g. GitHub code / deployed application), which makes it difficult for the system to track the time that the reviewers spend on the submissions.
Project Description
CSC/ECE 517 classes have helped us by “tagging” review comments over the past two years. This is important for us, because it is how we get the “labels” that we need to train our machine-learning models to recognize review comments that detect problems, make suggestions, or that are considered helpful by the authors. Our goal is to help reviewers by telling them how helpful their review will be before they submit it.
Tagging a review comment usually means sliding 4 sliders to either side, depending on which of four attributes it has. But can we trust the tags that students assign? In past semesters, our checks have revealed that some students appear not to be paying much attention to the tags they assign: the tags seem to be unrelated to the characteristic they are supposed to rate, or they follow a set pattern, like repeated patterns of one tag yes, then one tag no. Studies on other kinds of “crowdwork” have shown that the time spent between assigning each label indicates how careful the labeling (“tagging”) has been. We believe that students who tag “too fast” are probably not paying enough attention, and want to set their tags aside to be examined by course staff and researchers..
Proposed Approach
We would like to modify the model reflecting review tagging actions (answer_tag entity), adding new fields to track the time interval between each tagging action, as well as revise the controller to implement this interval tracking functionality. A few things to take into consideration: A user might not tag reviews in sequence, they may jump through them and only tag the one he or she is interested When annotator tags 1 rubric of all reviews then move onto the next, their behavior will be much different compared with those who tags 4 rubrics of each review. Sometimes an annotator could take long breaks to refresh and relax, some even take days off, these irregularities needs to be handled. A user may slide the slider back and forth for a number of times, then go to the next slider; they may also come back and revise a tag they made, these needs to be treated differently. The first step would be to examine the literature on measuring the reliability of crowdwork, and determine appropriate measures to apply to review tagging. The next step would be to code these metrics and call them from report_formatter_helper.rb, so that they will be available to the course staff when it grades answer tagging. There should also be a threshold set so that any record in the answer_tags table created by a user with suspect metrics would be marked as unreliable (you can add a field for that to the answer_tags table).
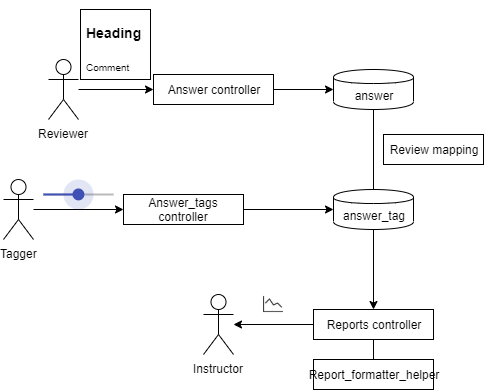
We propose to use `updated_at` in `answer_tags` model for each user to calculate gaps between each tagging action, then use `report_formatter_helper` together with `reports_controller` to generate a separate review view. Filtered gaps would be presented in the form of line-chart, with the `chartjs-ror` gem connecting the `Chart.js` component in front end.
This specific project does not require a design pattern, since it only requires using same type of class in generating same type of objects.
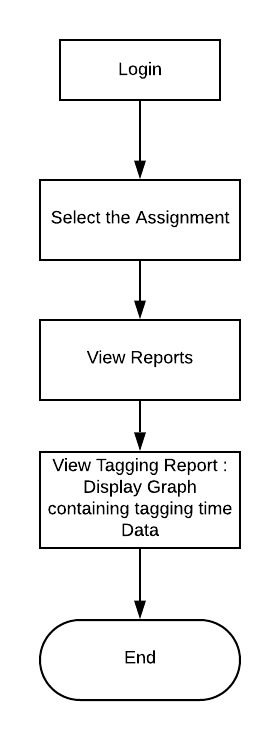
Behavior Diagram for Instructor/TA Diagram
Implementation
To create a chart within the front end, we went through the list of already installed gems to avoid enrolling complexity to the existing environment. We did find a gem chartjs-ror and decide to bring out our implementation with the package.
What chartjs does is it takes a series of parameter and compile them into different kinds of graphs when getting called in front-end, so this project is divided into several components:
Preparing
- Extracting data
- First we would need to see what data is needed in generating report, we found that:
- We would need student information to generate report for the specific student
- We would need Assignment information to generate report for assignment (currently the report button is under each assignment)
- We would need Review data to see what could be tagged
- And we would need tagging information to generate time associated with it
- First we would need to see what data is needed in generating report, we found that:
- Compiling chart parameters
- This stage requires understanding of the gem, this particular gem takes two piece of information
- Data, which include the data to be presented on the chart as well as labels associated with axis's
- Options, which captures everything else, including size of chart and range of data to be displayed
- This stage requires understanding of the gem, this particular gem takes two piece of information
- Calling gem to generate graph
Implementation
- Data
Data is stored across multiple tables, specifically if we need to gather Assignment, review, tagging, and user data, we would need at least Tag_prompt_deployment and answer_tags table. The report_formatter_helper file (which is in charge of generating reports) calls the assignment_tagging_progress function while generating rows (taggers) within a report, so we added a function within to calculate time intervals of everyone's tagging actions:
  def assignment_tagging_progress
    teams = Team.where(parent_id: self.assignment_id)
    questions = Question.where(questionnaire_id: self.questionnaire.id, type: self.question_type)
    questions_ids = questions.map(&:id)
    user_answer_tagging = []
    unless teams.empty? or questions.empty?
      teams.each do |team|
        if self.assignment.varying_rubrics_by_round?
          responses = []
          for round in 1..self.assignment.rounds_of_reviews
            responses += ReviewResponseMap.get_responses_for_team_round(team, round)
          end
        else
          responses = ResponseMap.get_assessments_for(team)
        end
        responses_ids = responses.map(&:id)
        answers = Answer.where(question_id: questions_ids, response_id: responses_ids)
        answers = answers.where("length(comments) > ?", self.answer_length_threshold.to_s) unless self.answer_length_threshold.nil?
        answers_ids = answers.map(&:id)
        users = TeamsUser.where(team_id: team.id).map(&:user)
        users.each do |user|
          tags = AnswerTag.where(tag_prompt_deployment_id: self.id, user_id: user.id, answer_id: answers_ids)
          tagged_answers_ids = tags.map(&:answer_id)

          # E1993 Track_Time_Between_Successive_Tag_Assignments
          # Extract time where each tag is generated / modified
          tag_updated_times = tags.map(&:updated_at)
          # tag_updated_times.sort_by{|time_string| Time.parse(time_string)}.reverse
          tag_updated_times.sort_by{|time_string| time_string}.reverse
          number_of_updated_time = tag_updated_times.length
          tag_update_intervals = []
          for i in 1..(number_of_updated_time -1) do
            tag_update_intervals.append(tag_updated_times[i] - tag_updated_times[i-1])
          end

          percentage = answers.count == 0 ? "-" : format("%.1f", tags.count.to_f / answers.count * 100)
          not_tagged_answers = answers.where.not(id: tagged_answers_ids)

          # E1993 Adding tag_update_intervals as information that should be passed
          answer_tagging = VmUserAnswerTagging.new(user, percentage, tags.count, not_tagged_answers.count, answers.count, tag_update_intervals)
          user_answer_tagging.append(answer_tagging)
        end
      end
    end
    user_answer_tagging
  end
end
We extracted each student's tagging information of reviews towards a specific assignment, sorted the tagging action in order and calculated intervals between each action, this information is passed back to the report_formatter_helper in a VmUserAnswerTagging data structure, so we added a new field as well as reader and writer within it:
class VmUserAnswerTagging
  def initialize(user, percentage, no_tagged, no_not_tagged, no_tagable, tag_update_intervals)
    @user = user
    @percentage = percentage
    @no_tagged = no_tagged
    @no_not_tagged = no_not_tagged
    @no_tagable = no_tagable
    # E1993 Adding interval to be passed for graph plotting
    @tag_update_intervals = tag_update_intervals
  end

  attr_accessor :user
  attr_accessor :percentage
  attr_accessor :no_tagged
  attr_accessor :no_not_tagged
  attr_accessor :no_tagable
  attr_accessor :tag_update_intervals
end
While from the front-end, the _answer_tagging_report partial who's in charge of generating report table would call the user_summery_report function within the report_formatter_helper to generate information for each user, we made sure that the interval information is passed to it and correctly evaluated: Helper:
  def user_summary_report(line)
    if @user_tagging_report[line.user.name].nil?
      # E1993 Adding extra filed of interval array into data structure

      @user_tagging_report[line.user.name] = VmUserAnswerTagging.new(line.user, line.percentage, line.no_tagged, line.no_not_tagged, line.no_tagable, line.tag_update_intervals)
    else
      @user_tagging_report[line.user.name].no_tagged += line.no_tagged
      @user_tagging_report[line.user.name].no_not_tagged += line.no_not_tagged
      @user_tagging_report[line.user.name].no_tagable += line.no_tagable
      @user_tagging_report[line.user.name].percentage = calculate_formatted_percentage(line)
      @user_tagging_report[line.user.name].tag_update_intervals = line.tag_update_intervals
      # E1993 interval array doesn't gets updated by new records in TagPromptDeployment, it's once computed and final (when you generate a new report)
    end
  end
Front end:
<% report_lines.each do |report_line| %>
                <tr>
                  <td><%= report_line.user.name(session[:ip]) %></td>
                  <td><%= report_line.user.fullname(session[:ip]) %></td>
                  <td><%= report_line.percentage.to_s %>%</td>
                  <td><%= report_line.no_tagged.to_s %></td>
                  <td><%= report_line.no_not_tagged.to_s %></td>
                  <!-- E1993 Call chart plotting function from review_mapping_helper -->
                  <td align='left'>
                    <%= display_tagging_interval_chart(report_line.tag_update_intervals) %>
                  </td>
                  <!-- <td><%= report_line.tag_update_intervals.to_s %></td> -->
                  <td><%= report_line.no_tagable %></td>
                </tr>
<% end %>
- Parameters for the chart gem
The other big component is to generate information for the gem to use
  def display_tagging_interval_chart(intervals)
    # if someone did not do any tagging in 30 seconds, then ignore this interval
    threshold = 30
    intervals = intervals.select{|v| v < threshold}
    if not intervals.empty?
      interval_mean = intervals.reduce(:+) / intervals.size.to_f
    end
    data = {
      labels: [*1..intervals.length],
      datasets: [
        {
          backgroundColor: "rgba(255,99,132,0.8)",
          data: intervals,
          label: "time intervals"
        },
        if not intervals.empty?
          {
            data: Array.new(intervals.length, interval_mean),
            label: "Mean time spent"
          }
        end
      ]
    }
    options = {
      width: "200",
      height: "125",
      scales: {
        yAxes: [{
          stacked: false,
          ticks: {
                beginAtZero: true
            }
        }],
        xAxes: [{
          stacked: false
        }]
      }
    }
    line_chart data, options
  end
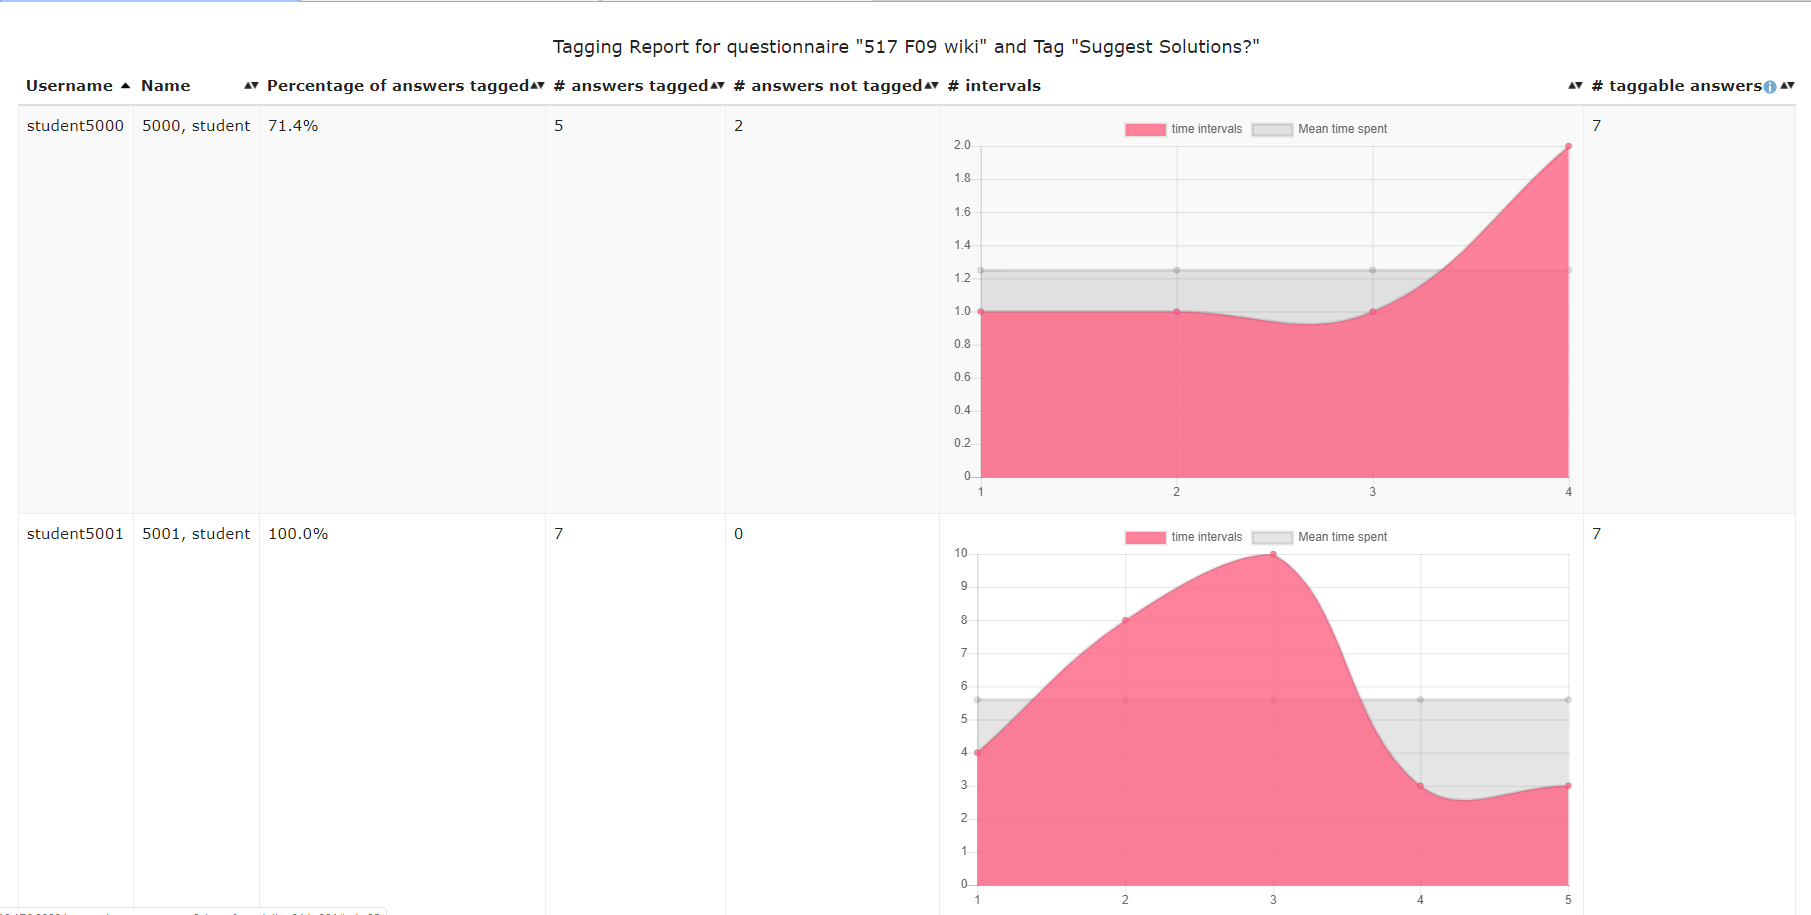
In this step, we filtered out intervals that are larger than 30 seconds, because as we were testing this function, we found having more than 30 second's interval in the graph would affect the scale of it and making smaller time intervals visually indifferent to viewers. To create a visual effect that is similar across all users, we set the y axis to always start from 0. Besides the basics, we've also plotted a average time spent on each tag (with abnormalities filtered) to provide additional visual cue for the teaching team.
- Plotting graph
As could be seen in the code block above, we called the function as well as the implementation from the gem in our front end and plotted interval graphs for each student tagger:
<%= display_tagging_interval_chart(report_line.tag_update_intervals) %>
Proposed Test Plan
Automated Testing
Automated testing is not available for this specific project because:
- To test the review tagging interval one has to
- Create courses
- Create assignment
- Setup assignment dues dates as well as reviews and review tagging rubrics
- Enroll more than 2 students to the assignment
- Let students finish assignment
- Change due date to the past
- Have students review each other's work
- Change review due date to the past
- Have students tag each other's work, with time intervals (pause or sleep between each review comment, having at lease one interval longer than 3 minutes)
- Generate review tagging report
- Generate review tagging time interval line chart
And you cannot verify what's on the line chart with Rspec since it's a image, we wouldn't be able to see if the interval greater than 3 minutes is filtered
Each time this script runs, it would take minutes to test, let along having the intervals, and each time Expertiza runs a system level testing, this script would be included, adding who knows how long to the already too long testing process.
Thus we propose to verify this function in non automated ways
Testing
 As described, we tested this feature in the following sequence:
- As instructor
- Create courses
- Create assignment
- Setup assignment dues dates as well as reviews and review tagging rubrics
- Enroll more than 2 students to the assignment
- As Student
- Finish assignment
- As instructor
- Change due date to the past
- As Student
- Review each other's work
- As instructor
- Change review due date to the past
- As Student
- Have students tag each other's work, with time intervals both over and under 30 seconds
- As instructor
- Generate review tagging report
- Generate review tagging time interval line chart
The result is shown in the graph above, manual testing showed that intervals greater than threshold did get filtered and students without any tagging activities are dropped in graph creation.
Note
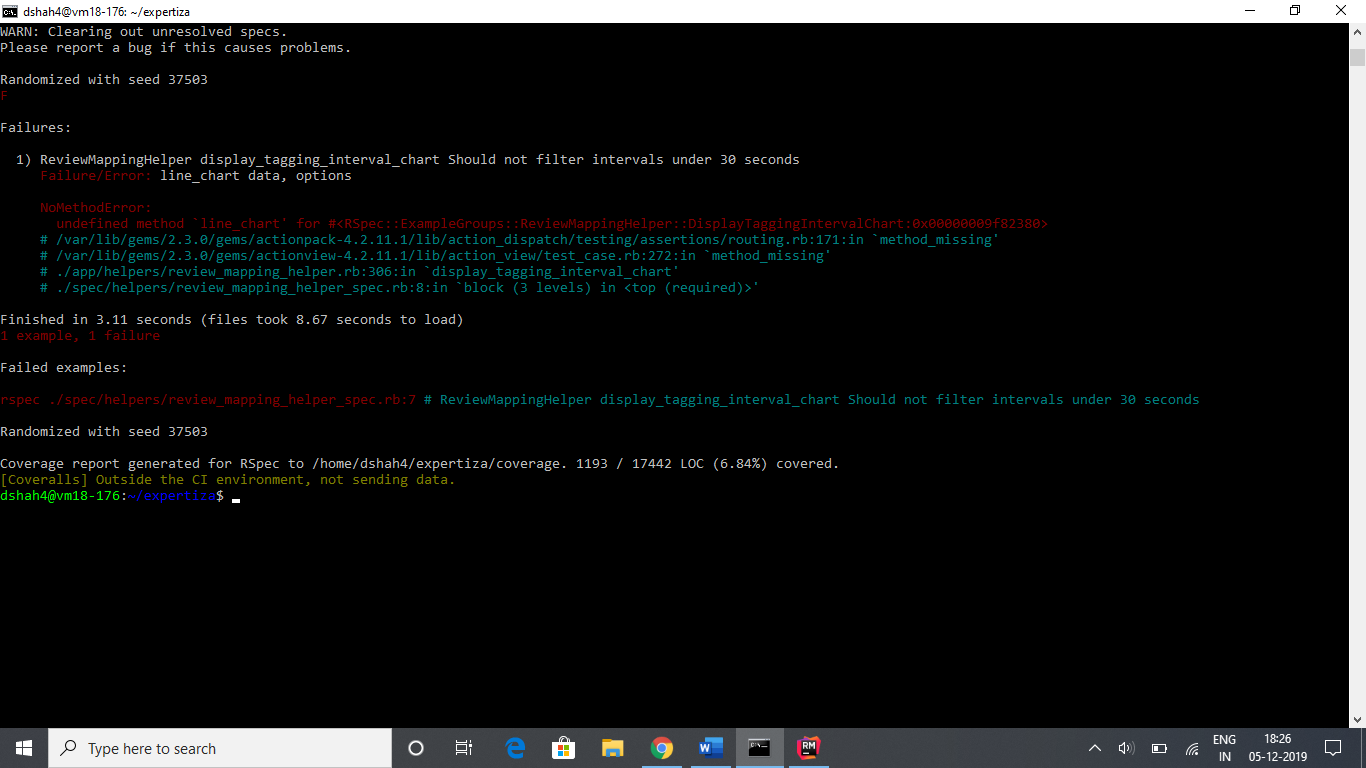
We did try to auto mate this process, but is stopped in the last step while validating the graph created, as the function is wrapped in the gem and cannot be accessed from RSepc:

You may also want to see our testing video [here]
We'd also like to suggest a refactor of the code, since some old functions are spread from model to controller to view and parts of it is been run for unnecessary times, too much data is getting passed back and forth including data that shouldn't be given to the view.
Team Information
- Anmol Desai(adesai5@ncsu.edu)
- Dhruvil Shah(dshah4@ncsu.edu)
- Jeel Sukhadia(jsukhad@ncsu.edu
- YunKai "Kai" Xiao(yxia28@ncsu.edu)
Mentor: Yunkai "Kai" Xiao (yxiao28@ncsu.edu) Mohit Jain(mjain6@ncsu.edu)

