CSC/ECE 517 Spring 2023 -G2335. Develop Frontend UI Interface for GraphQL Query
Topic Overview
Motivation
Numerical data are important in providing insights. However, in raw format, numerical data are hard to grasp and introduce more confusion than information. Graphical presentations of numerical data are needed to draw insights and focus from the available data.
For this project, we are developing the front-end user interface for GraphQL query for a desktop application to display summary statistics of Github repository and Github users' contribution to said repository. Github provides GraphQL API for developers who are interested in the raw data surrounding each Github repository and user. Such data can be used to develop metrics to monitor a repository's activities, performance, community involvement, community usage, and contribution from the community and collaborators. The main focus of this project is developing a UI to display these metrics and summary statistics in graphical and tabular formats to provide clients with insights into their own Github repository or any Github repository they are interested in.
Our interface design will be developed from scratch based on client requirements (project requirements). We aim to make this design and interface a building block and sound foundation for future projects that want to extend our use case or build similar applications.
Scope
As our project focuses on the design and front-end interface of the application, back-end calls to fetch and methods organize data from Github GraphQL API will not be handled. Instead, the data will be stubbed using pre-process datasets in CSV files. These files are the products of data fetched from Github API and organized for ease of accessing and rapid development of the front-end.
Additionally, as the interface will be developed from scratch and the time allotted for this project, we will be focusing on basic displays and graphs of the data.
Feature Requirements
Raw Data
The raw data we are working with contain these fields
| Metrics | Column Names | Explanation |
|---|---|---|
| Days | lifeSpan
|
Days of Github experience before class. |
| A | commitContributions
|
The number of private and public commits made by this user. |
| B | commitComments, issueComments, gistComments, repositoryDiscussionComments, repositoryDiscussions
|
The number of comments made by this user in commits, issues, and pull request discussions. |
| C | pullRequests, pullRequestReviewContributions
|
The number of PR and PR reviews made by this user. |
| D | issues, projects
|
The number of issues, and projects created by this user. |
| E | Alanguagecount + Clanguagecount
|
The number of different languages used in user's type I repositories. |
| F | Alanguagesizet + Clanguagesize
|
The size of code written in Github popular languages in user's type I repositories. |
| G | Blanguagecount + Dlanguagecount
|
The number of different languages used in user's type II repositories. |
| H | Blanguagesizet + Dlanguagesize
|
The size of code written in Github popular languages in user's type II repositories. |
| I | repoACount, repoBCount, repoCCount, repoDCount
|
The total number of type I, and type II repositories. |
| J | forkACount, stargazerACount, Awatchers, forkCCount, stargazerCCount, Cwatchers
|
The total number of forks, stars, and watchers in type I repositories. |
| K | forkBCount, stargazerBCount, Bwatchers, forkDCount, stargazerDCount, Dwatchers
|
The total number of forks, stars, and watchers in type II repositories. |
| L | repoASize, repoCSize
|
The total code size of type I repositories. |
| M | repoBSize, repoDSize
|
The total code size of type II repositories. |
Features
The followings are the features that the desktop application is required to have
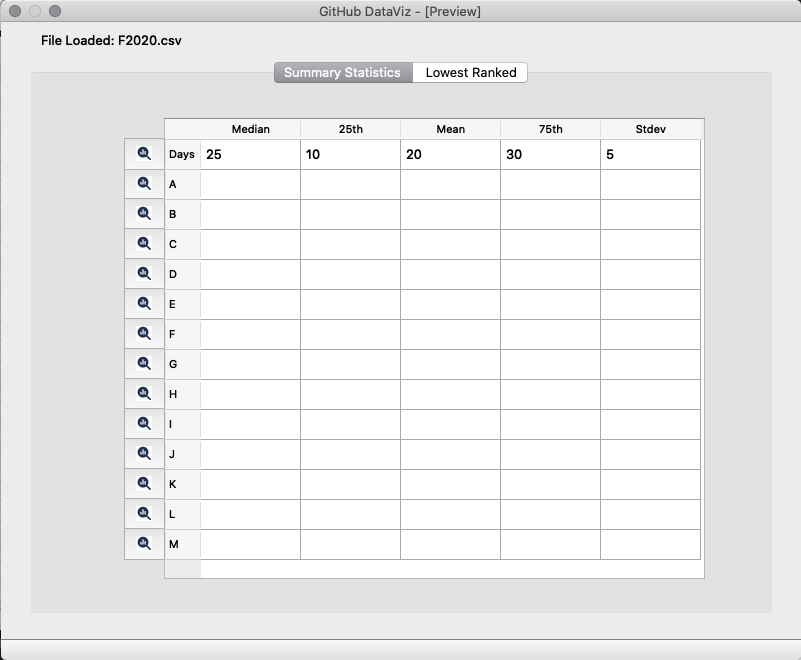
- A table for basic statistics ((median, 25th, mean, 75th percentile, stdev) in the following format
| median | 25th | mean | 75th | stdev | |
|---|---|---|---|---|---|
| Days | |||||
| A | |||||
| ...other metrics... |
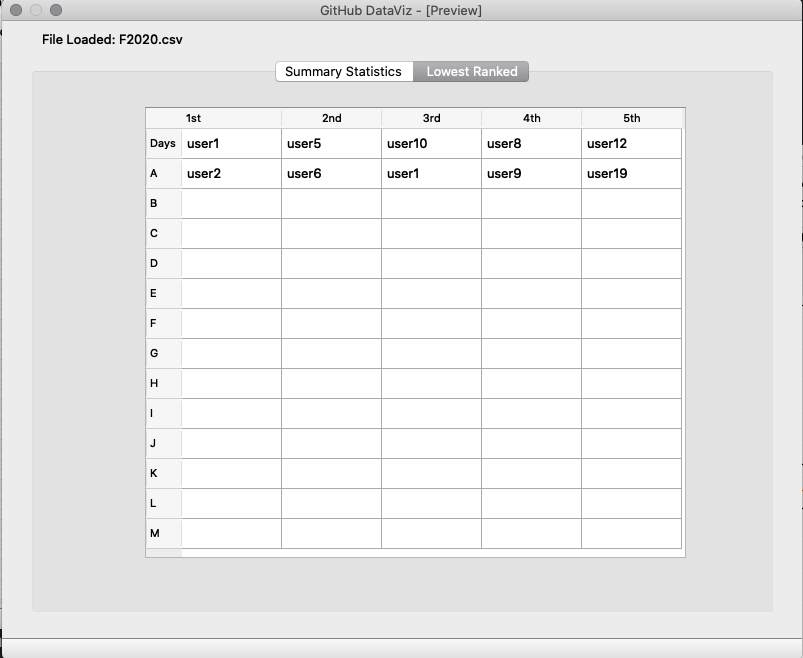
- A table for the lowest ranked 1/5 username in the following format
| 1st | 2nd | 3rd | 4th | 5th | |
|---|---|---|---|---|---|
| Days | USER 10 | USER 2 | USER 6 | USER 18 | USER 21 |
| A | USER 5 | USER 1 | USER 13 | USER 22 | USER 19 |
| ...other metrics... | ... | ... | ... | ... | ... |
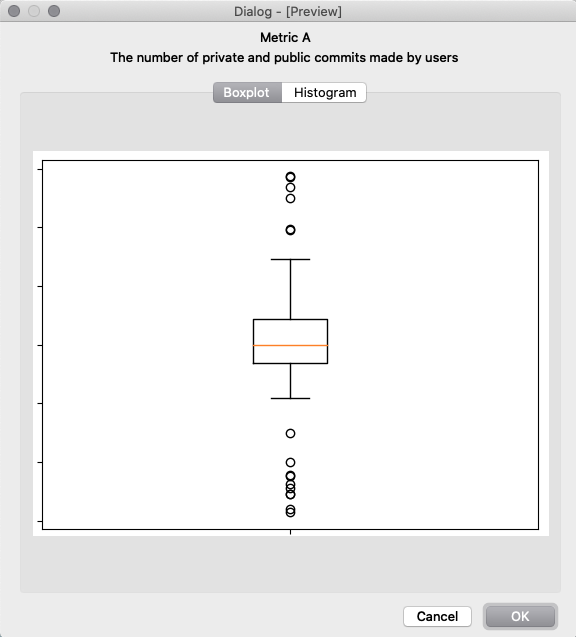
- A boxplot for each of the metrics listed
- A histogram for each of the metrics listed
Interface Design
User Interaction
With the GUI of our application, we aim to create an interactive workflow where users can drill into each metric, graph, and summary statistics table by clicking. Thus, prevent a ton of scrolling or production of unnecessary charts that flood the interface. Additionally, if users choose to have an extensive report generated with all the information included, they can. This report will include all the metrics, graphs, and summary statistics tables that users can generate individually. The following graph shows the workflow of our ideal application design
Mockup Design
The mockups below were created using Qt Designer, a graphical interface builder that produces XML-based mockups that can be converted into working python-based pyQt code.
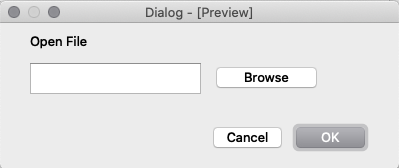
The current design consists of a desktop application that allows the user to browse for and select a csv-based data file (1), loads and processes the data from the csv into tables for summary stats (2) and the lowest ranked users (3) for each metric. On the summary stats table, the user can select the chart icon to bring up a popup that has details about the metric and tabs to show a boxplot (4) and histogram (5) for the selected metric.
1. Open File
2. Summary Stats
3. Lowest Rank
4. Boxplot
5. Histogram
Implementation Details
Tools
The interface for the desktop application will be developed using
Version: Python 3.0
- matplotlib to render graphs
- Qt Designer to mock-up the application UI using a drag-drop interface of pyQt
Implementation
Todo: Inlcude implementation details
Testing
For this project, we planned to use use the following tools to test the GUI of our application
Test plan
Todo: include testing plans
Test results
Todo: include testing results
Future Work
For this project, our goal is to develop a solid foundation for a desktop application that reports Github data in an informative manner. Our design focuses on displaying the most imperative information to users while avoiding requiring users to engage in complex and unnecessary interactions. We focus on a simple graphical view to avoid overwhelming users with multiple graphs and data.
As a front-end project, our application contains mainly front-end components with a few basic functions behind the scene that do computation and rendering graphs. The backend data pipeline is stubbed using pre-processed CSV files of data fetched manually from Github GraphQL API. However, the connection between the data and the GUI is designed so that the GUI can work with a full-fledged data pipeline. As a result, for future work, we hope to extend our application functionality so that it has a functional backend data pipeline that can take in a user input command to fetch data directly from Github API, process it, and then display information.
Besides having a fully functional application with a backend data pipeline, the following features can be added to the application:
- Users can combine graphs and compare metrics.
- Users can compare the performance and metrics of a Github account to another (or multiple other) account(s).
- Users can manually add texts and annotations to graphs generated by the application.
- Users can export graphs and reports into pdf or image formats (e.g., PNG, and JPEG)
Contributors
- Aileen Jacob (amjacob2)
- Anh Nguyen (anguyen9)
- Joe Johnson (jdjohns4)
- Mentor Jialin Cui (jcui9)
Related Links
- Github repo NEED TO BE MADE PUBLIC


