CSC/ECE 517 Fall 2020 - E2082. Track time between successive tag assignments
Project Overview
Background
The Expertiza project takes advantage of peer review among students to allow them to learn from each other. Tracking the time that a student spends on each submitted resource is meaningful for instructors to study and improve the teaching experience, and also in evaluating the quality/sincerity of the reviews.
Previous work done in Fall 2019 enables tracking time between successive time tag assignment.

However, there are several problems with their solution:
- There is no automated tests using mocked data to test their implementation.
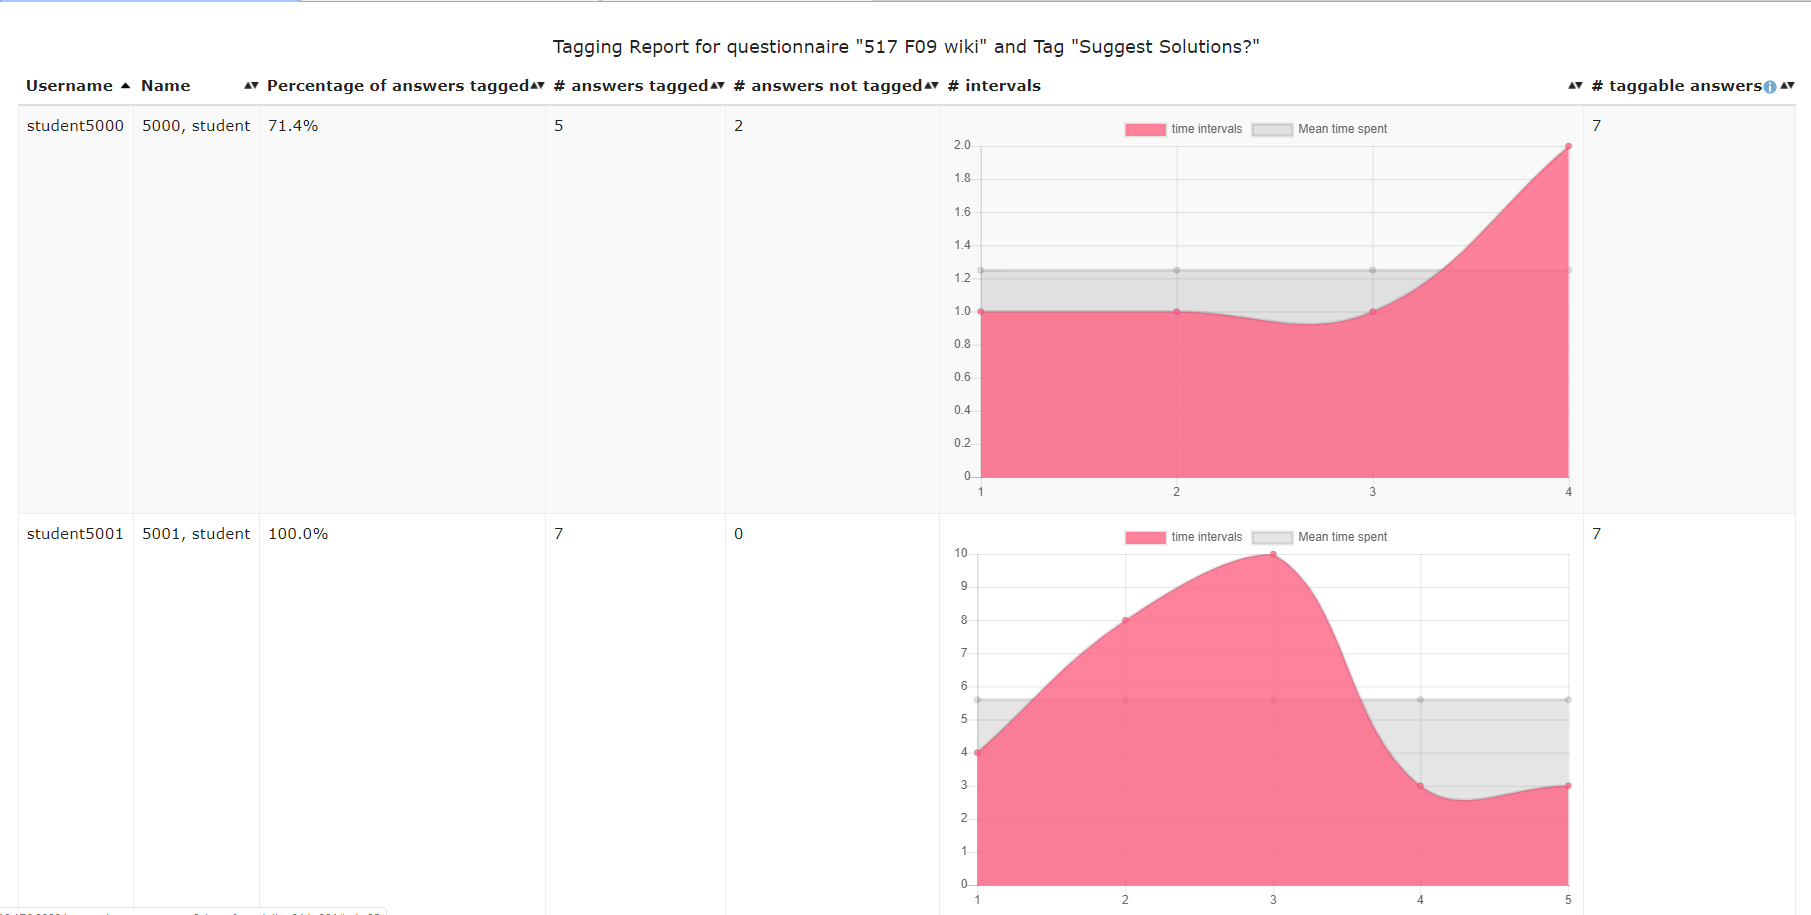
- The previous team added a tagging interval chart to each row (representing each participant) in the Answer Tagging report. However, the chart will be hard to read if there hundreds of tagging interval.
Previous Work
The following links are the deliverables from the original implementation in Fall 2019.
- CSC/ECE 517 Fall 2019 - E1993 Track Time Between Successive Tag Assignments
- Youtube Explanation
- Git Repository
- Git Pull Request
Objective
- Display the tagging interval information as a number alongside the graph in order to make it more intuitive to read
- Add test cases regarding new changes
Example Mockup of Added Column

Our Implementation
File Involved
helpers/review_mapping_helper.rb
The method calculate_key_chart_information(intervals) was added to calculate the average, min, max, variance and standard deviation from the tagging intervals recorded. These key analytics were then returned as a hash.

views/reports/_answer_tagging_report.html.erb
This view was modified to print an additional column for the answer tagging report. The column added was "Key Graph Info" which prints the hash that is returned from the method display_key_chart_information(). The hash is printed as a bulleted list.

Results
We were able to display key information from the generated graph as an additional column to the answer tagging report.
Design
We propose a method that aims to perform:
1. Query the database for details on reviews and their tags
2. Update the existing chart logic to process these numbers
3. Update the report format to include these times
4. Add tests for internal logic and manual UI-testing too
HOW: We'll create an independent method for our logic and append it to the existing logic without necessarily modifying it
Test Plan
To manually reproduce the scenario on the UI and test the results on our new/modified time reports
1. Manually impersonate the process of tagging reviews for a dummy assignment
2. Test that the tag times are recorded and displayed properly
3. Compare it with previous logic to check that values/logic is consistent
4. Regression test just to see that the existing charts aren't broken
Manual Testing
1. Logged in as Instructor 6 with username = instructor6 and password = password
2. Click "Manage..." -> "Assignments" from the top-left menu item
3. Create a new assignment by clicking the + button
4. Filling the necessary information in "General", "Rubrics", and "Due Dates" sections indicated in the following screenshots. Then click Create button.
5. Edit Tagging Assignment and click add new.. under Tag prompt dropdown list
6. Click the green + on the top-right of the popup window. Enter the value for prompt and desc as shown in the screenshot below. Click green + button at the right most column.
7. Select Criterion for apply to question type. Click Save button.
8. Click the Add Participants button, then add student7339 and student7430.
9. Logged in as student7339 with password=password and make a submission from Your work
10. Logged in as instructor6 and modify Tagging Assignment due date for Round 1: Submission to be two days before today.
11. Logged in as student7430 with password=password and submit review from Others' work
12. Logged in as instructor6 and modify Tagging Assignment due date for Round 1: Review to be one day before today.

13. Logged in as student7339 and tag the review from <Your scores>
14. Logged in as instructor6. Go to manage...->Assignment and click View Reports button.
15. Select Answer Tagging Report and click View button.
16. The highlighted column in blue rectangle is the new feature we added
Unit Tests
Tests were added to test the accuracy of calculating the statistics of the timings we have tracked in this project. The comprehensive test can test all the math logic involved in our design.
Other Information
Pull Request
https://github.com/expertiza/expertiza/pull/1848
Video URL
Team
Joshua Aaron Horwitz (jahorwit)
Varun Varadarajan (vvarada2)
Nicholas Viado (ndviado)
Tsu-Hsin Yeh (tyeh3)
Mentor: Kai Xiao (yxiao28)


