CSC/ECE 517 Fall 2018- Project E1858. Github metrics integration
Introduction
Problem Statement
Expertiza provides View Submissions and Teammate Reviews (under View Scores) functionality for each assignment. Purpose of this project is to augment existing assignment submissions with data that can give a more realistic view of the work contribution of every team member using external tools like GitHub. This external data may include: number of commits, number of lines of code modified, number of lines added, number of lines deleted from each group’s submitted repository link from GitHub.
- 1. View submissions functionality provides a list of submissions of all the teams for a particular assignment. We can add a new column to show work distribution within the whole team using external tools like GitHub. A new column will display this information using line-graphs and other statistics.
- 2. Teammate Reviews functionality in the View Scores page gauges teammate views on how much other team members contributed to the project. We need to augment this data with data from external tools like GitHub in order to validate that feedback. New metrics will be appended under each student data under the same functionality.
This information should prove useful for differentiating the performance of team members for grading purposes. Overall data for the team, like the number of committers and number of commits may also help instructors to predict which projects are likely to be merged.
Current Scenario

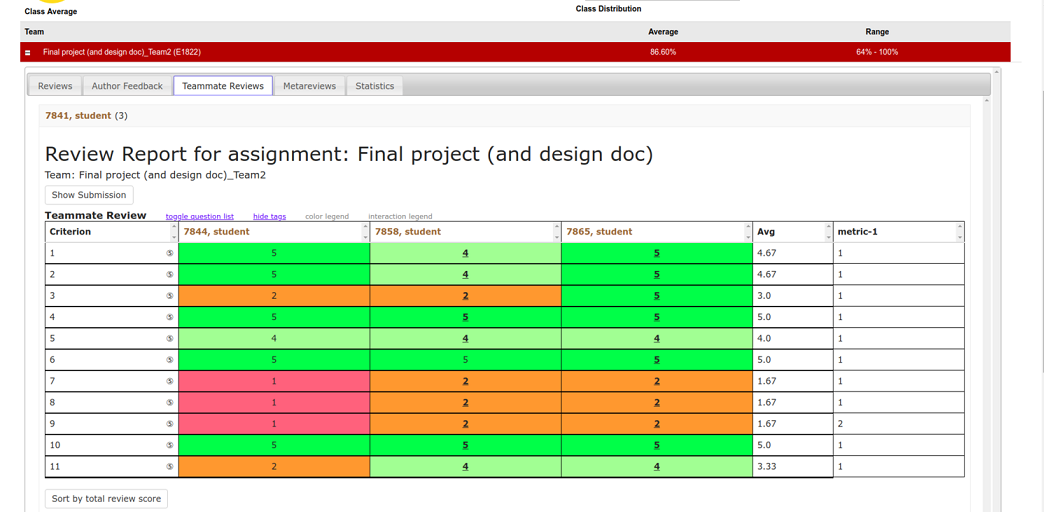
Checking commits performed by each team member on GitHub is a solution, but that is inefficient from instructor's/reviewer's perspective as there are many assignments, submissions, and tight deadlines.
Proposed Solution Design
Design Considerations
- The first thing is to determine what metrics we are looking for exactly. These are what the requirements document suggests:
- Total number of commits.
- Number of files changed.
- Lines of Code added
- Lines of code modified.
- Lines of code deleted.
- LOCs that survived until final submission - (exclude from MVP due to the complexity and lower priority).
- We are assuming these metrics are needed on a per-user basis.
- The requirement document expects a view to be created for viewing the metrics under a new tab “GitHub Metrics” under “View Submissions” in the instructor view.
- A line chart of the number of lines vs time needs to be included in the view.
- The next thing is to narrow down what hosting service for version control we will use. For now, the plan is to only support GitHub integration due to its popularity, ease-of-use and API documentation. Future projects could add in support for Gitlab and others, though it is far easier to just require that all students use GitHub.
- The main impact of this change will be that all submission repositories need to be made public as we need access to pull in the data.
- We also need to consider whether to ask students for GitHub repository link separately(changes to views) or to parse all the uploaded links and determine the correct one (extra logic, students uploading multiple links or not giving links at all).
- An important question is whether we need to store metric information in our own db at all.
- An older investigation came up with this schema, but this is likely to cause issues with stale information and will be difficult to maintain.
- Having a db is redundant as every time a user wants to see the metrics, we would need to sync the db with GitHub and then show the results. So we end up hitting GitHub API anyway.
- An alternative to the above approach is to take snapshots of metrics and store them in the db right on the submission deadline of projects. This will allow for fairer grading by making sure we pull in data at the correct moment. Unfortunately, doing this for so many projects could put a lot of load on the server. Also, for open source projects, this would mean that we don’t have the latest data to work with(people will keep committing past the deadline). Thus, this approach might be good for grading purposes but doesn’t help with determining the current status of a project.
- All that said, we might need to maintain some meta-data in our db- investigation pending.
- We also need to consider if we need to account for different branches. The initial plan is to only consider the master branch.
- A suggestion was also to make sure that there isn’t a lot of padding in the tables we show.
- With respect to showing GitHub metrics in the View scores page, it will be very difficult to map Expertiza users and their names to public GitHub profiles as students may use a different name. So instead of appending GitHub data to Teammate reviews table, it would be easier to just add a new tab called "GitHub Metrics" and show the results there.
- The instructors will need to spell out exact guidelines for committing to the project's repositories(like everyone should commit their own code, keep the master as PR branch, commit regularly, be mindful of squashing too many commits for one user), so that we can have proper and correct data and, also so that students can’t weasel their way out later claiming they worked but forgot or didn’t know.
Use Case Diagram
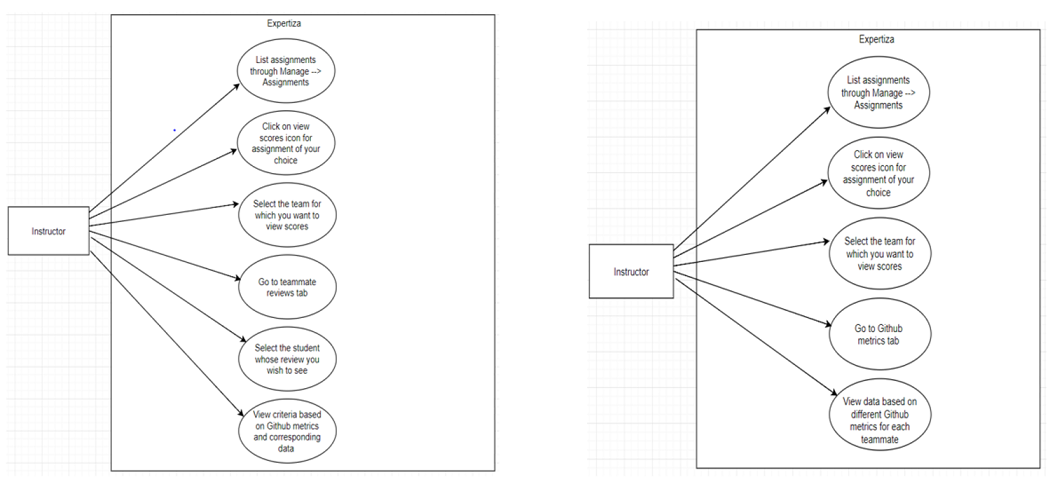
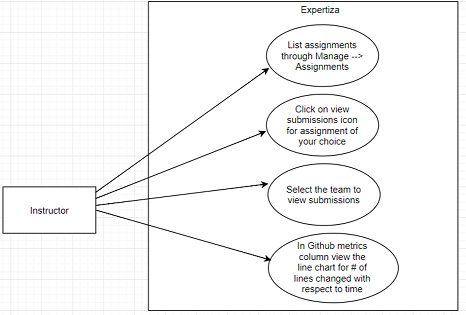
Use Case Diagram Details
Actors:
- Instructor: This actor is responsible for creating assignments and adding students to the assignment.
- Student: This actor is responsible for submitting, self-reviewing, and viewing the scores.
Database:
- The database where all the data of Expertiza is getting stored.
Pre Conditions:
- The Student should submit the assignment and self-review.
- The other students should submit the reviews of the work submitted.
Primary Sequence:
- The student should login.
- The student should browse and upload the assignment.
- The student should submit the assignment.
- The student should submit teammate-reviews.
Post Conditions:
- Instructor will be able to see the team contribution done by each team member in 'View Submission' page using graph diagrams, as shown in the figure.
- Instructor will be able to see the work done by each student in 'Teammate Review Tab' with new metric appended at the end, as shown in the figure.
Design Principles
- MVC – The project is implemented in Ruby on Rails that uses MVC architecture. It separates an application’s data model, user interface, and control logic into three distinct components (model, view and controller, respectively). We intend to follow the same when implementing out end-point for pulling GitHub data.
- Dry Principle – We are trying to reuse the existing functionalities in Expertiza, thus avoiding code duplication. Whenever possible, code modification based on the existing classes, controllers, or tables will be done instead of creating the new one.
Design Detail
First Change
- The first change would would be under the "Teammate Review" tab in the "View Scores" page.
Approach 1
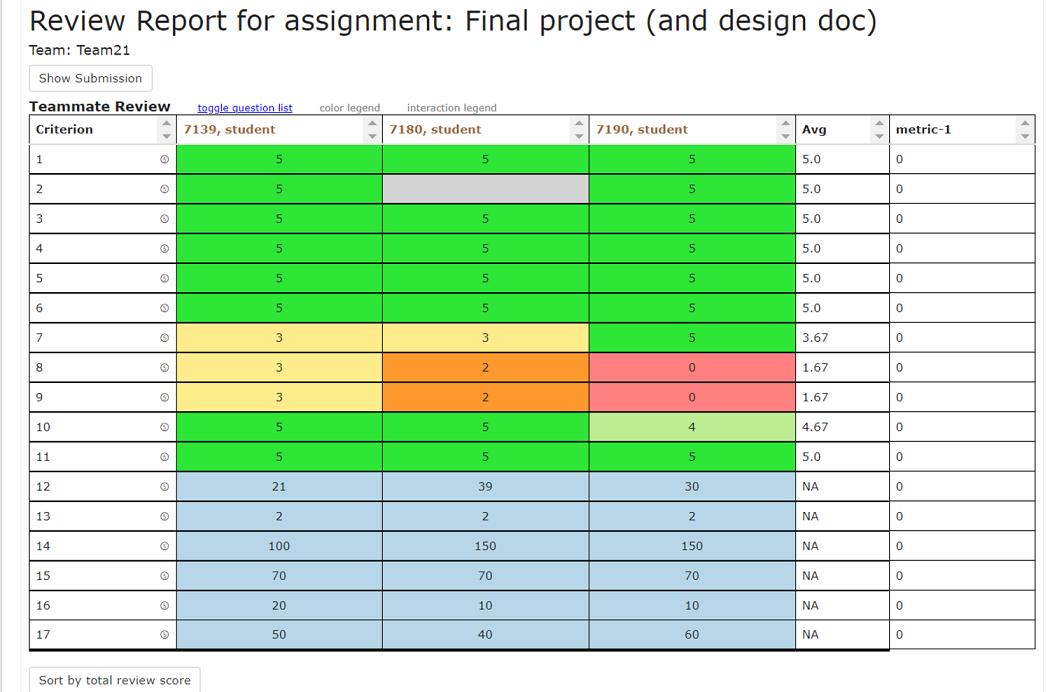
- We either add new rows to the table, one for each of the GitHub metrics, and display the results for every student in the project as mocked up here:
Approach 2
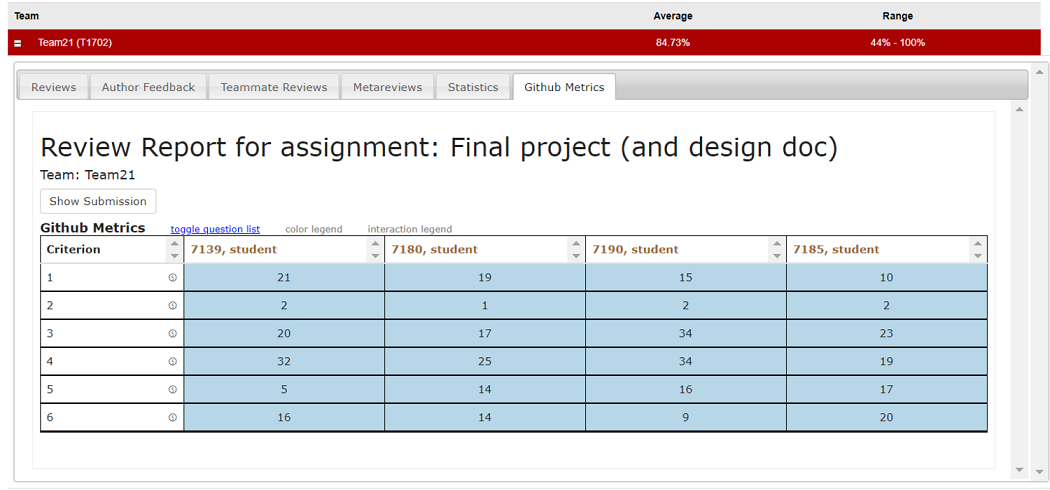
Or we might add a new tab called "Github Metrics" in the View scores page and then show the metrics and the results in tabular format as mocked up:
Second Change
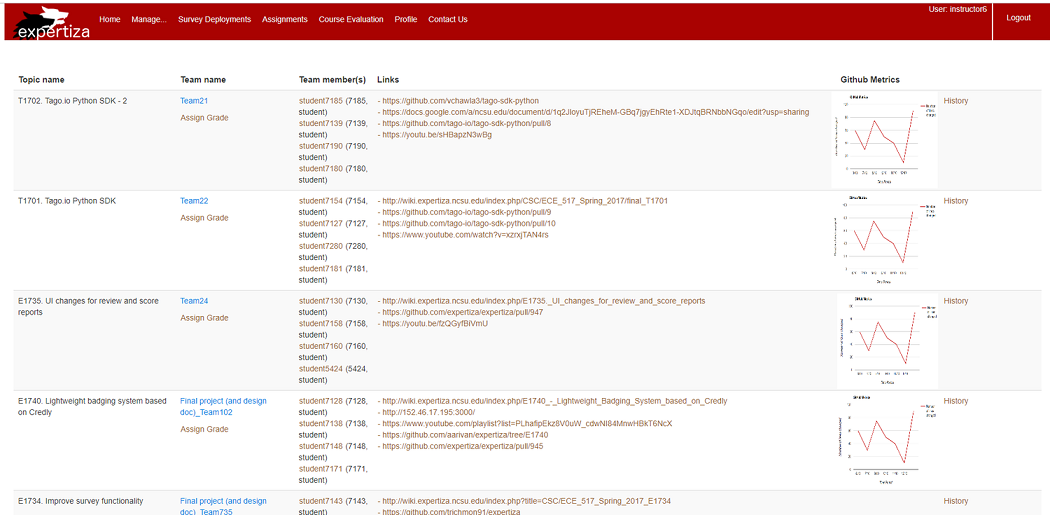
- The second change is in the View Submissions page, where we intend to add a new column to the table that shows a chart per assignment team.
Database Design
As of now, we do not have plans for database modifications. As number of commits and LOCs(lines of code) will keep of changing and stale data does not seem to be of significant benefit for analysis, we will be concentrating on latest state of project repositories.
Plan of action
- The first thing is to investigate if there are any rails gems(Octokit/Unicorn maybe?) to get GitHub data and if we are allowed to use them. The idea is to always get the latest data from GitHub and show it to the user. For grading purposes, we could alternate a view between the latest data and data till submission deadlines.
- If there are no such gems or if we aren’t allowed to use gems, we need to write to mock endpoints to understand out how to get data from GitHub. There is ample documentation for this. The GitHub API returns JSON which can be easily parsed.
- We then need to figure out how to load this data(AJAX? or gem?) when instructor selects “GitHub Metrics”(if we do this) or "Teammate Review" in the View Scores page. Similar data needs to be loaded in the View Submissions page.
- We will need a mock-up view to display this data in a table.
- We then implement the view. For charting, a suggestion is to use a previous project- 1 2 3.
Test Plan
Subtask 1: GitHub metrics in teammate reviews
Test plan for proposed solution 1:
1) Log in as an instructor
2) Navigate to assignments through Manage --> Assignments
3) Select "View scores" icon for the assignment of your choice
4) Select the team for which you wish to view scores
5) Go to "GitHub metrics" tab
6) View data based on different GitHub metrics (e.g. lines of code added/changed/removed etc.) for each teammate
Test plan for proposed solution 2:
1) Log in as an instructor
2) Navigate to assignments through Manage --> Assignments
3) Select "View scores" icon for the assignment of your choice
4) Select the team for which you wish to view scores
5) Go to "Teammate reviews" tab
6) Select the student for whom you wish to view teammate review
7) Below the usual criteria, view criteria for different GitHub metrics (e.g. lines of code added/changed/removed etc.) portrayed in a different color scheme (light blue)
Subtask 2: Line chart for # of lines changed by the overall team
1) Log in as an instructor
2) Navigate to assignments through Manage --> Assignments
3) Select "View submissions" icon for the assignment of your choice
4) Select the team whose submissions you wish to view
5) A newly added GitHub metrics column is added to show # of lines changed since the start of the assignment