CSC/ECE 517 Fall 2013/ch1 1w12 vn
Introduction
Rails is an open-source web application framework which makes use of Ruby programming language. With its huge library of gems and support for MVC architecture, it provides an easy and clean approach for creating pages, talking to web server and dealing with databases. Debugging is always an important part of any application development for which Rails provides a tremendously good support despite being an interpreted language as opposed to C or Java or any other compiled language.
Debugging Options
Rails provides a range of options to make debugging easier. Some of these options have been discussed in the sections below.
Debug Helpers
One of the easiest ways to debug is to simply output the value of different variables which provides us the first look into what could be going wrong. This could be done in all of models, views and controllers. Rails provides three methods-debug, to_yaml and inspect to achieve this task. These methods create human-readable data from any object [1]. The examples below show the output when these methods are used in a view.
| Code | Output |
|---|---|
| <%= @users.to_yaml %> | --- - !ruby/object:User attributes: id: 2 name: Jimmy Page email: jimmy.page@gmail.com created_at: 2013-09-14 02:37:16.322638000 Z updated_at: 2013-09-16 20:38:04.250678000 Z |
| <%= @users.inspect %> | #<ActiveRecord::Relation [#<User id: 2, name: "Jimmy Page", email: "jimmy.page@gmail.com", created_at: "2013-09-14 02:37:16", updated_at: "2013-09-16 20:38:04">]> |
| <%= debug @users %> | ---
- !ruby/object:User attributes: id: 2 name: Jimmy Page email: jimmy.page@gmail.com created_at: 2013-09-14 02:37:16.322638000 Z updated_at: 2013-09-16 20:38:04.250678000 Z |
Logger
Logger class in ruby help us to save information at runtime . A log file gives information like : various sql queries related to the database, methods executed on the controller, attributes of the controller. Default logger for Rails is ActiveSupport::Logger and log files varies for different runtime environments.
- To display information of log file on terminal window(UNIX, development environment) :
tail -f log/development.log
- Custom messages for debug can be put in models, controllers and views using below mentioned method:
logger.debug logger.debug_variables
for any other custom class :
RAILS_DEFAULT_LOGGER
For example : logger.debug “This point redirects the user”, logger.info “request is processing”
- Format of the logger messages can be changed by overwriting the method
format_messages(level, time, progname, message)
- There are 5 logging levels with 0 (debug) being the lowest.
FATAL: An error that cannot be handled and results in a program crash ERROR: An error that cannot be handled WARN: A warning INFO: Information about system operation DEBUG: Information for developers
Level order is DEBUG < INFO < WARN < ERROR < FATAL. Default logger level for dev environment is debug , default for production environment is info.
To change default log level :
- In environment file : config.log_level or
- Rails.logger.level = 0
- To configure a new logger :
   	config.logger = Logger.new(..)

           We can also specify a logger x  in our environment file as :
Rails.logger = x::Logger.new(..)
- To completely clear log messages :
rake log:clear
Graphical Debugger
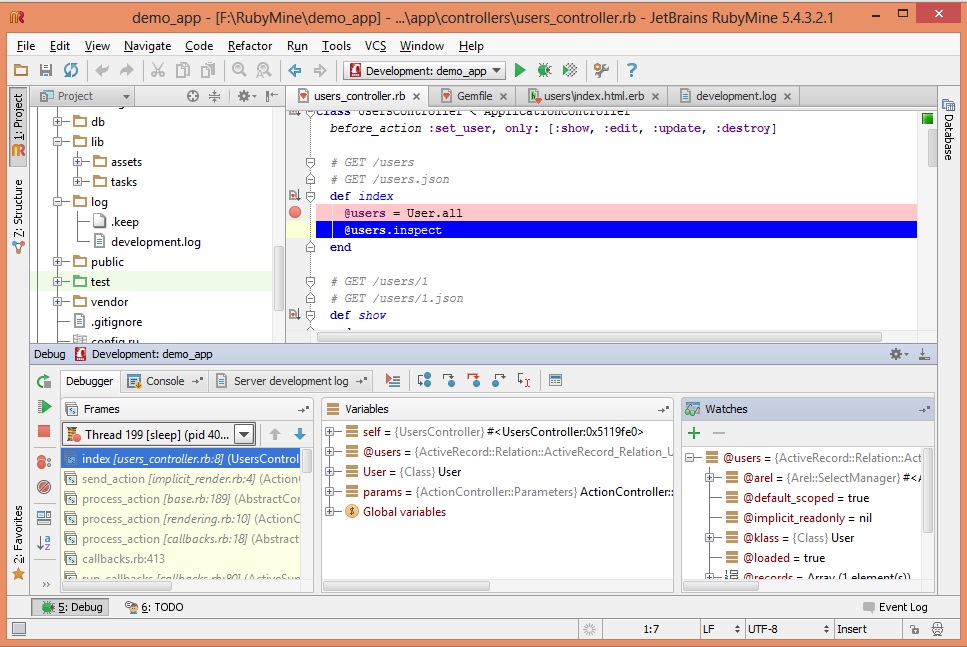
Rubymine, a commercial IDE by JetBrains, has a graphical debugger for ruby and rails code. It provides important and useful features such as smart breakpoints, dedicated view for watches and stack, expression evaluator, etc. Some of the key features related to debugging are presented below.
- Breakpoint
One can put breakpoint by simply clicking on the start of the line in the window or pressing Ctrl+Shift+F8. Breakpoint feature highlights the corresponding line in the code.
- Frames, Variables and Watches
Rubymine debugger shows a separate window for frames, variables and watches when the execution hits a breakpoint. User can look in the corresponding window for more information.
- Evaluate code and expressions
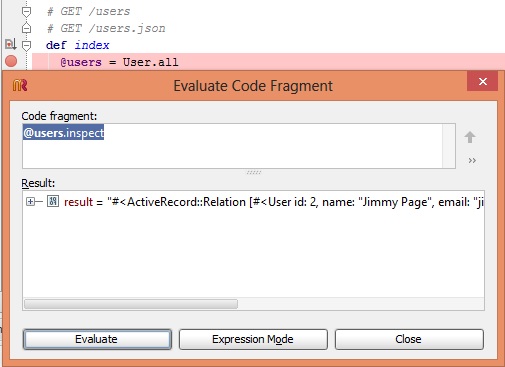
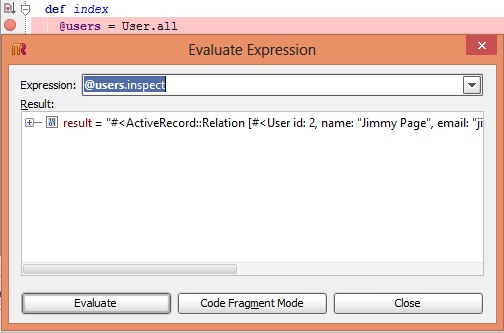
Users can type in expression or code and evaluate it when the breakpoint is hit or on the fly.
- Options
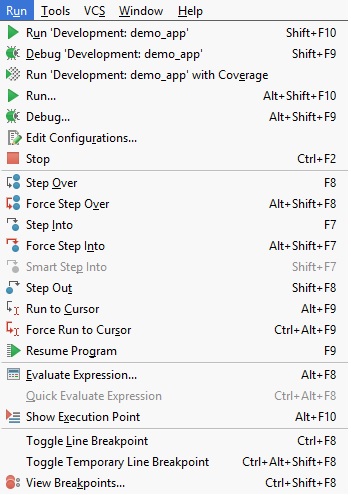
Rubymine debugger provides a lot of other options for debugging.


