CSC/ECE 517 Spring 2013/OSS E734: Difference between revisions
(→View) |
|||
| Line 164: | Line 164: | ||
For our new implementation of analytic we decided to move to jQuery and hightchart. | For our new implementation of analytic we decided to move to jQuery and hightchart. | ||
jQuery is a powerful, popular, and well maintained webpage AJAX library for javascript, its documentation is available here [http://api.jquery.com/]. For the UI part, we use highchart which is a jQuery compatible chart library, the documentation: [http://api.highcharts.com/highcharts]. Licenses for these two libraries are GPL and CC by 3.0 for non-commercial usage. | jQuery is a powerful, popular, and well maintained webpage frontend AJAX library for javascript, its documentation is available here [http://api.jquery.com/]. For the UI part, we use highchart which is a jQuery compatible chart library, the documentation: [http://api.highcharts.com/highcharts]. Licenses for these two libraries are GPL and CC by 3.0 for non-commercial usage. | ||
The original jQuery library used by Expertiza is version 1.4, we have it upgraded to version 1.9 in this project, locates at /public/javascripts/jquery.js and highchart is at /public/javascripts/highcharts.js. | The original jQuery library used by Expertiza is version 1.4, we have it upgraded to version 1.9 in this project, locates at /public/javascripts/jquery.js and highchart is at /public/javascripts/highcharts.js. | ||
====chart object and chart==== | |||
Chart object is an ruby object created by calling Chart.new(type, data, [option], [width]). It is just a ruby object representing the chart. | |||
In order to display the chart, you need to render '_chart.erb', this partial will create html and javascript code for a given chart (represented by the chart object). | |||
====code responsibilities==== | |||
If one do not want to 'customize' the chart, see ''render_sample.html.erb'' for quick setup examples. If one want to 'customize' charts, or want to understand ''index.html.erb'', here is something need to know: | |||
* '''views/analytic/_chart.erb''': render a chart represented by given chart object. it handles all javascript headers, javascript and HTML for you. see ''render_sample.html.erb'' for detail. | |||
* '''views/analytic/_static.erb''': JSON format chart grid theme descriptor, this is a global settings which will affect all chart. | |||
* '''model/analytic/chart.rb''' | |||
** '''''get_id_str''''': get the unique id of the container element of chart, only meaningful when all charts are created by rendering "_chart.erb". | |||
** '''''test_data''''': Create test data for chart. | |||
** '''''data_template''''': Creates chart settings template. All chart object created by Chart.new() is based on this template. One can overwrite this method to get full control of the chart to be created. (Note: This is a global settings which will affect all chart with corresponding chart type.) | |||
** '''''initialize''''': create a chart object, parameters are: | |||
*** ''type'': specify the type of the graph(:bar, :line, :pie, :scatter) | |||
*** ''data'': data to be represented by the chart. see ''render_sample.html.erb'' for details. | |||
*** ''option'': optional parameter, one can specify some frequently used chart options here, default value is nil. see ''render_sample.html.erb'' for details. | |||
*** ''witdh'': optional parameter, specify the width of the chart, like "500px" or "80%", default is "100%". see ''render_sample.html.erb'' for details. | |||
====DOM tree in index.html.erb==== | |||
Enable nulti-chart support by specifing ''multi_chart = true'' at the beginning of the <script> section. Default value is false. | |||
Structure of the tree looks like this: | |||
All charts will be in one container, selector should be '#draw_area'. Each chart and its corresponding options is in its own container with selector '.chart_X' where X is the index of that chart. Within each chart container, selector '.option' will return an container contains all end-user-specified options (chart type, comparison scope, courses, asssignments, etc), selector '.chart' will give the chart container. Unless all required options are specified, chart will not be displayed. | |||
====Javascript Event Listener==== | |||
== Controller == | == Controller == | ||
Revision as of 10:21, 29 April 2013
Developers:
- Hao Liu (hliu11@ncsu.edu)
- Zhuowei Wang (zwang18@ncsu.edu)
- Chunxue Yang (cyang14@ncsu.edu)
This page is the design documentation for Expertiza project E734 conducted in the CSC/ECE 517 Spring 2003 class at North Carolina State University. Learn more about Expertiza by visiting its main page: http://wikis.lib.ncsu.edu/index.php/Expertiza
Introduction
The Expertiza project is system for using peer review to create reusable learning objects. Students do different assignments; then peer review selects the best work in each category, and assembles it to create a single unit.
The process of reviewing includes reviews, re-reviews and meta reviews of assignments submitted by students for a course. This method of evaluation also inherently suggests that there will be vagaries in the way reviews have been performed.
This project aim to provide a way for the users to examine various type of statistic about the courses, assignments and reviews.
Objective
The original objective of the project is to extend the Analytic project E732 from previous semester to incorporate new features. Upon examination the implementation of E732 we decided to start from scratch and create a developer friendly and easily extendable framework for providing analytic data and displaying analytic data.
To fulfill our purpose of providing a better experience for Expertiza users, we have several different aspects of to focus on.
The primary focus of this project is on reviews and the related aspects that go hand in hand with reviews like meta reviews, re-reviews etc. To be more specific, we will be working on an advanced search interface in which different criteria can be selected more flexibly to make a comparison for each review or meta review.
Moreover, we will dedicate in developing a more dynamic and clear chart graph. In our project, JavaScript libraries such as jQuery.js (GPL), highchart.js(CC by 3.0) are included to support the dynamic behaviors of the chart graph. Multi chart areas are supported by Dom Tree.
Graphical User Interface (GUI) Design
Original Design
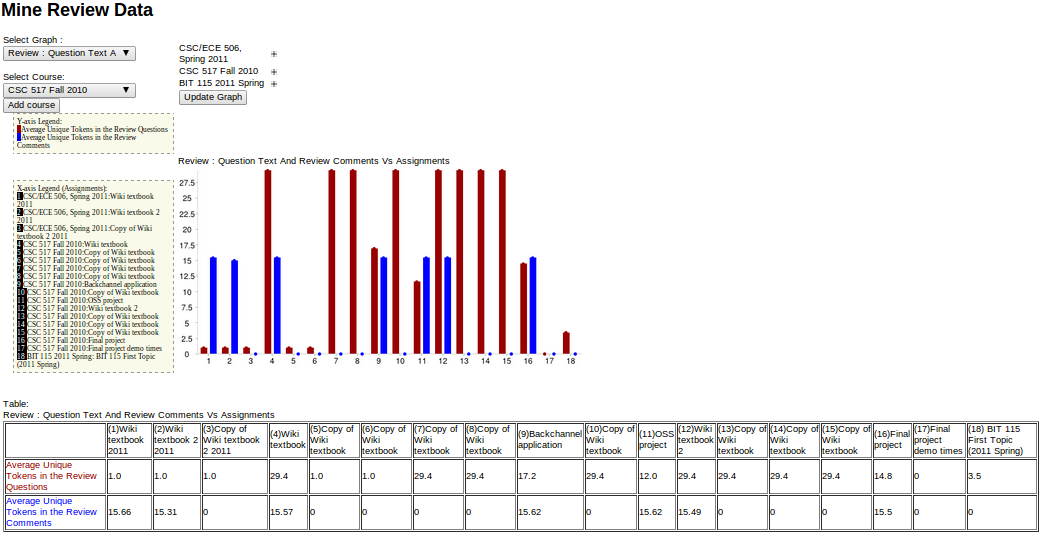
In the original GUI design of analytic the user can select from a list of cryptically worded data comparison:
- Review: Question Text And Review Comment vs Assignment
- Review: Question Count And Review Comment vs Assignment
- Review: Sub Question Count And Review Comment vs Assignment
- Average Review Parameters And Student Experience vs Assignment
- Average Metareview Parameters And Student Experience vs Assignment
- Assignment Strategy And Review Parameter
Besides the unfathomable meaning options, the design does not provide much room for the user of the page to explore and discover interesting correlations between data. Since the objective is to enable user to discover correlations between data, this implementation does not really meet the requirement.
After selecting a graph type the user can add courses to the graph. Upon selection the all of the assignments from the course are added to the graph than the user can un-select the assignments from a drop down menu. Once a course is selected there's no way to remove a course from the selection.
There are no option for selecting how the data are presented, data are displayed as a bar graph which restrict the type of data that can be displayed.
The specific numeric value for the graph are displayed below the graph as a chart.
New Design
Graph Type and Comparison Scope Selection
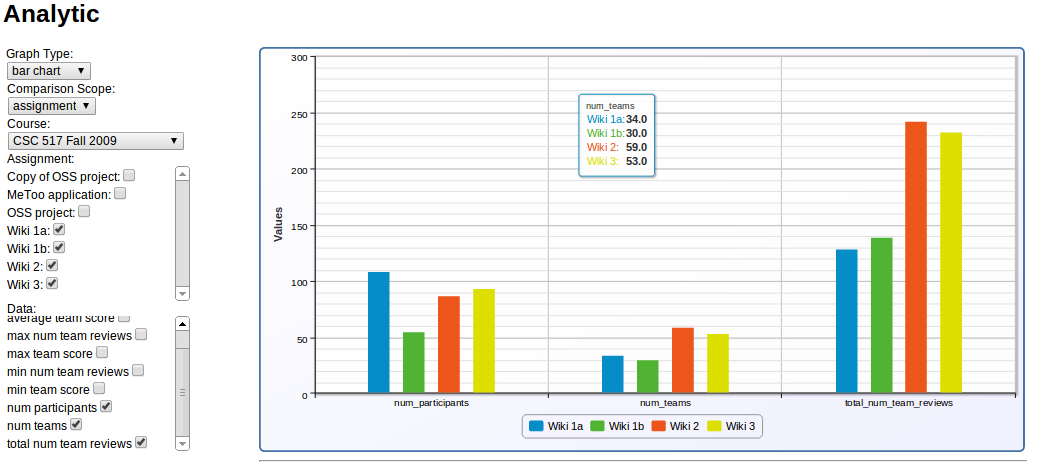
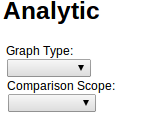
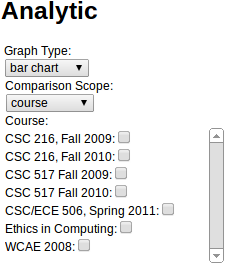
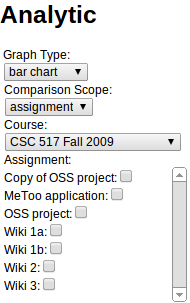
When the user arrive at the analytic page they are prevented with two options: Graph Type and Comparison Scope.
First, in the new design we would like to offer the user and developer more options for displaying the data, instead of the restriction of only using bar graph.
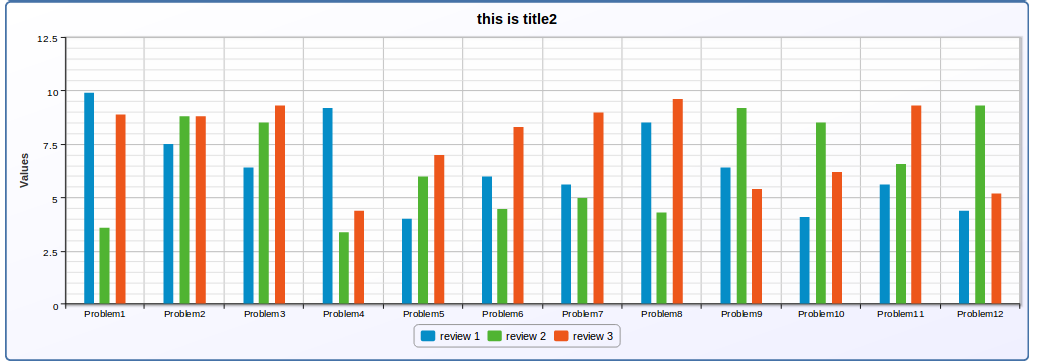
Graph type let the user select what kind of graph do they want the data to be displayed currently there are four different options:
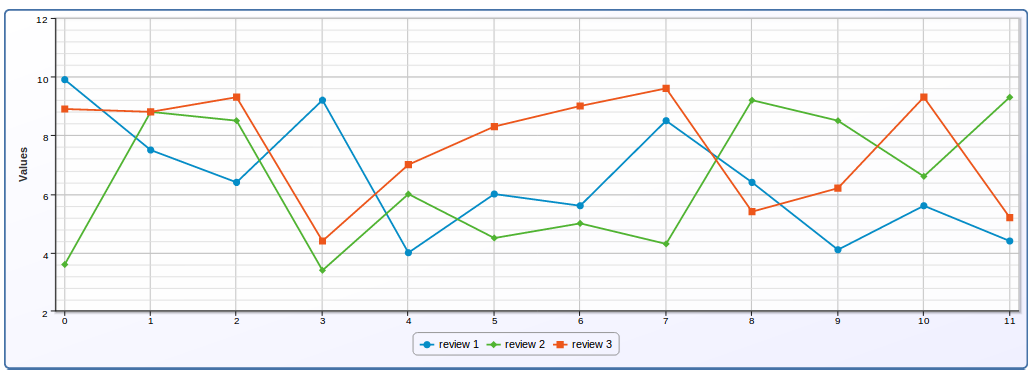
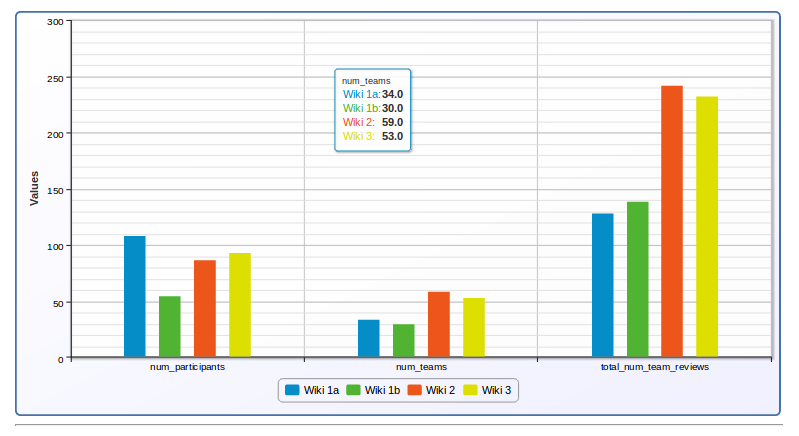
- Bar Graph - useful for displaying simple numeric comparisons (i.e: average scores, number of participants)
- Line Graph - useful for displaying comparison of distributions (i.e: grade distribution for assignments)
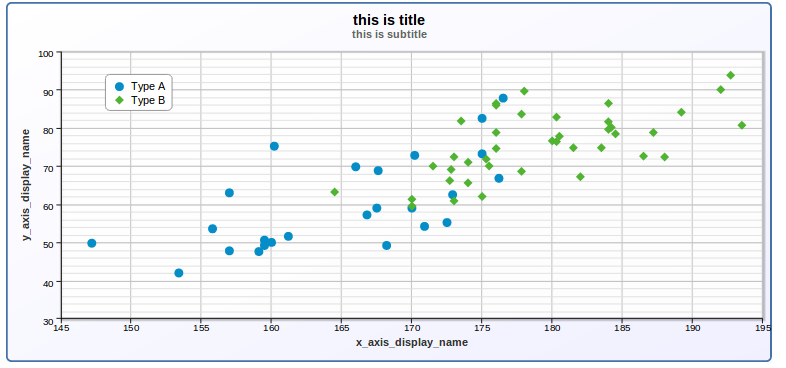
- Scatter Plot - useful for displaying raw data points (i.e: grades for all of the student for assignments)
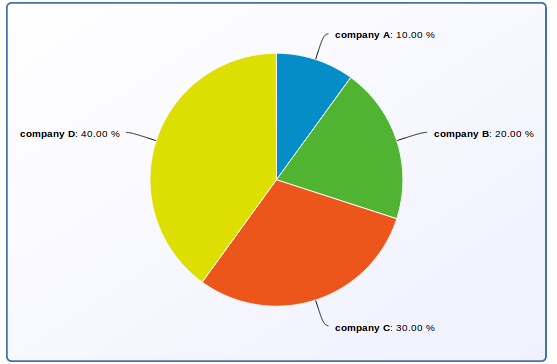
- Pie Chart - useful for displaying percentage related data (i.e: percentage of grade distribution for an single assignment)
Second, we would like to offer the user more scope of comparison instead restricting to only assignment wise comparison
Comparison scope give user options to select what do they want to compare:Course, Assignment, Team
Comparison Object Selection
After the user select the graph type and comparison scope the user are presented with options to select comparison object and comparison data. These options changes depending on the graph type and comparison type.
Comparison object depends on what comparison scope the user selected. For example:
If the user select course wise comparison scope than the user will be presented with a check-box list of courses that they are allow to view.
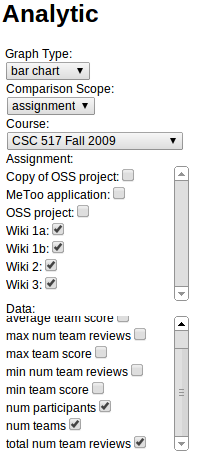
However if the user select assignment wise comparison scope the user will be presented with drop down menu with list of courses that they are allow to view and once the user select the course that they are interested in the are presented with a check-box list of assignments that are within the courses.
User can select multiple object that they want to compare and the graph will update dynamically.
Comparison Data Selection
Options for comparison data depends on both comparison scope and graph type. A check-box list will be displayed containing the appropriate data type that are available for the selected graph type and selected comparison scope.
Development Note: Currently we only finish the options related to for bar graph, however the framework for adding options related to other type of graph has been completed.
The user can select multiple type of graph data and the graph will be updated dynamiclly
Graph Display
Once all of the selections are complete a graph containing the data will be rendered. We would like to retain the ability to display the numeric value for the data, however table containing all of the data in the graph is not the most efficient way to to percent the data instead in the new implementation the numeric value for the data will be display when the user hover the curer over the graph.
Framework Design
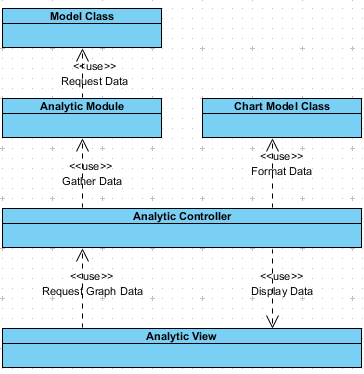
Architecture of the Expertiza Analytic Framework is based on the model-view-controller design pattern used in Rails application.
Model
There are two tasks that analytic require the model to perform: data mining and data formating.
Data Mining
The data mining operations performed by model classes gathers the data requested by the controller.
Original Implementation
In the original implementation of analytic, data mining methods use to extract the data are scattered between the assignment model class and controller. There are several problems with this method of implementation.
First, assignment model is crucial class for the correct operation of the Expertiza and the data mining methods are not related to the normal operation that the model performs this reduces the readability and maintainability of the model.
Second, the data mining methods seem to recursively traverse through the data structure hierarchy level by level (for example: to obtain average grades for assignment, the original implementation do assignment->for each teams-> for each responses->score->grade) in-order to obtain the data that they need. This design violates basic object oriented programming principle, instead the data mining methods should be layered and methods should be added to the corresponding models to avoid this behavior.
New Implementation
The new implementation of analytic the data mining methods are implemented as mixin modules for the corresponding models. The modules are gathered into the /models/analytic folder. The modules contains the analytic methods for the model that they relates to. The analytic modules only calls the methods that are defined in model that they corresponds to and methods defined in other analytic module.
This implementation creates a clear separation between the normal model operation and data mining operation; abstract away the complexity of the structure of the underlying databases; improves the readability for the developer.
Related Files
Analytic modules and their corresponding models:
- expertiza/app/models/analytic/course_analytic.rb => expertiza/app/models/course.rb
- expertiza/app/models/analytic/assignment_analytic.rb => expertiza/app/models/assignment.rb
- expertiza/app/models/analytic/assignment_team_analytic.rb => expertiza/app/models/assignment_team.rb
- expertiza/app/models/analytic/questionnaire_analytic.rb => expertiza/app/models/questionnaire.rb
- expertiza/app/models/analytic/question_analytic.rb => expertiza/app/models/question.rb
- expertiza/app/models/analytic/response_analytic.rb => expertiza/app/models/response.rb
- expertiza/app/models/analytic/question_analytic.rb => expertiza/app/models/question.rb
- expertiza/app/models/analytic/score_analytic.rb => expertiza/app/models/score.rb
Data Formatting
The data formatting operations take the gathered data and formatted turn it into the format that are require by the methods that draws the charts that display the data.
Original Implementation
The original implementation of analytic have the controller handles data formatting function. In the MVC structure used in rails application, formatting the data is not a responsibility for the controller.
New Implementation
The new implementation of analytic a Chart class was created to handle the formatting of data. The Chart class serve as a interface between the java script based front-end in view and the ruby model back-end. The controller passes the graph type and data into the Chart class and the Chart class will handle all formatting and return the data that controller can pass into view.
The example for the input data format and how to use the Chart class will be provided in later section.
Related files
- expertiza/app/helpers/chart.rb
Development Note: currently the Chart class located in the helper folder, this is not the proper location for the file. The file should be move to the models folder and rename to analytic.rb.
View
In analytic view displays options for the user, send user input to the controller and presents graph in a particular format, triggered by a controller's decision based on the user input.
Original Implementation
The original implementation of analytic leverages the google chart ruby gem to generate the graph in a static fashion. The graph data type that the user can request are hard coded into the view with lots of switch statements and if else statements to handle different cases. This method of implementation which limits what the user can see and dramatically increases the difficult for adding new data options that user can see. According to the documentation for the MVC architecture used in Rails, the decision for what to display should be handle by the controller.
Using google chart ruby gem is an acceptable implementation however the google chart gem have limited capabilities and a somewhat outdated look. Further more, the gem it might have the risk running into compatibly issues with future Rails version if the gem is not kept up to date.
New Implementation
javascript libraries
For our new implementation of analytic we decided to move to jQuery and hightchart.
jQuery is a powerful, popular, and well maintained webpage frontend AJAX library for javascript, its documentation is available here [1]. For the UI part, we use highchart which is a jQuery compatible chart library, the documentation: [2]. Licenses for these two libraries are GPL and CC by 3.0 for non-commercial usage.
The original jQuery library used by Expertiza is version 1.4, we have it upgraded to version 1.9 in this project, locates at /public/javascripts/jquery.js and highchart is at /public/javascripts/highcharts.js.
chart object and chart
Chart object is an ruby object created by calling Chart.new(type, data, [option], [width]). It is just a ruby object representing the chart.
In order to display the chart, you need to render '_chart.erb', this partial will create html and javascript code for a given chart (represented by the chart object).
code responsibilities
If one do not want to 'customize' the chart, see render_sample.html.erb for quick setup examples. If one want to 'customize' charts, or want to understand index.html.erb, here is something need to know:
- views/analytic/_chart.erb: render a chart represented by given chart object. it handles all javascript headers, javascript and HTML for you. see render_sample.html.erb for detail.
- views/analytic/_static.erb: JSON format chart grid theme descriptor, this is a global settings which will affect all chart.
- model/analytic/chart.rb
- get_id_str: get the unique id of the container element of chart, only meaningful when all charts are created by rendering "_chart.erb".
- test_data: Create test data for chart.
- data_template: Creates chart settings template. All chart object created by Chart.new() is based on this template. One can overwrite this method to get full control of the chart to be created. (Note: This is a global settings which will affect all chart with corresponding chart type.)
- initialize: create a chart object, parameters are:
- type: specify the type of the graph(:bar, :line, :pie, :scatter)
- data: data to be represented by the chart. see render_sample.html.erb for details.
- option: optional parameter, one can specify some frequently used chart options here, default value is nil. see render_sample.html.erb for details.
- witdh: optional parameter, specify the width of the chart, like "500px" or "80%", default is "100%". see render_sample.html.erb for details.
DOM tree in index.html.erb
Enable nulti-chart support by specifing multi_chart = true at the beginning of the <script> section. Default value is false.
Structure of the tree looks like this:
All charts will be in one container, selector should be '#draw_area'. Each chart and its corresponding options is in its own container with selector '.chart_X' where X is the index of that chart. Within each chart container, selector '.option' will return an container contains all end-user-specified options (chart type, comparison scope, courses, asssignments, etc), selector '.chart' will give the chart container. Unless all required options are specified, chart will not be displayed.
Javascript Event Listener
Controller
Method Overview
methods with post fix _list (graph_data_type_list, course_list, assignment_list, team_list) are use to populate the different selection in view.
get_graph_data_bundle method is use to generate the data for the graph in view
bar_chart_data, line_chart_data, scatter_chart_data, pie_chart_data located in analytic helper (expertiza/app/helpers/analytic_helper.rb) are the interface function between the analytic modules and chart class
Access Control
Goldberg menu system provided control for who can access the analytic page however it does not control what courses are displayed once they are in the analytic page. By assigning permission of administer assignment to the controller in Goldberg menu system we restricted the access of analytic to user with role of super-admin, admin, instructor and teaching assistant. However we would like the user to only be able to see the courses that they are associated with. To achieve that we the method associated_courses was added to the course helper (expertiza/app/helpers/course_helper.rb)
The associated_courses method returns a list of courses depending on the user's role. For super-admin and admin it will return all of the courses that are in the database. For instructor it will return the courses that belongs to the instructor. For teaching assistant it will return all the courses that they are TA-ing.
The course_list method in the analytic controller uses this method to determine which list should be listed on the course selection section of the view.
Adding New Option for the Data Type
The method graph_data_type_list is use to return a list of appropriate options for the data type selection in view.
@available_data_type is a hash of comparison_scope and graph_type with method names in the analytic modules initialized in the init method.
all of the methods within the analytic modules will be automatically pull into the @available_data_type[comparison_scope] (i.e: @available_data_type[:course] will contain all of the methods defined in the CourseAanlytic module) @available_data_type[graph_type] contain the subset of methods that in the analytic modules that are suited for the particular graph_type.
The method uses the cross section of @available_data_type[comparison_scope] and @available_data_type[graph_type] to determine the appropriated data type options in view
To add new data type simply add a the data mining method in the corresponding analytic module than add the name of the method as a string into @available_data_type for the appropriate graph_type
Developer Resources
github repository for the project the content of this repository might change suggest using the main repository for expertiza if the branch has already been merged
Development Environment Setup
- follow the instruction on expertiza wiki page to setup the development environment http://wikis.lib.ncsu.edu/index.php/Creating_a_Linux_Development_Environment_for_the_Expertiza_Application
note: you might need to delete the automated_metareview table from the database before you can successfully run db:migrate
- launch expertiza server (ruby script/server)
- visit the page from your browser (0.0.0.0:3000)
- login as admin (username: admin, password: password)
- setup access permission for the controller
- on the menu bar navigates to administration->setup->controller/action
- under the missing tab you should see analytic, click on it and select administer_assignment for the permission than click add
- under the application tab click on analytic and add index and render_sample to the action list
- add analytic to menu bar for easy access (alternatively just enter 0.0.0.0:3000/analytic in your browser)
- on the menu bar navigates to administration->setup->menu editor
- add an menu option for analytic/index
note: not all of the courses and assignments in scrubbed database are real (with actual data), in order to get courses and assignments that have real data you might want to consider impersonate a real instructor in the scrubbed data base (i.e: Dr.Geringer, user id: efg) this can be done by navigating to manage...->impersonate_user from the menu bar.
Rendering Example
For the benefit of future developers we provided examples on how to use the Chart class (chart.rb) to format data for the chart and how to use the jQuery stubs (_chart.html.erb) to render the chart
The example is located at expertiza/app/views/analytic/render_sample
To access the webpage created by this example visit 0.0.0.0:3000/analytic/render_sample (assuming you follow the setup instruction above)
Future Works
Sorted by task difficulty
- Move expertiza/app/helpers/chart.rb to expertiza/app/model and rename to analytic.rb
- Rename Chart class to Analytic
- Unit test
- Add data mining methods for meta-review
- Add options for displaying raw data point related data using scatter plot(for example: raw grades)
- Come up with other interesting data for the comparison scope
- Improve the performance of data mining methods especially score related methods.
- Add user comparisons (comparing student with student)
- Give control of options in the of graph type selection and comparison scope selection drop down to controller (require java script experience)
- Implement a static version of the index page using ruby (require java script experience)
- Strengthen access control by checking if the current user have permission to access to the data that they requested
IMPORTANT NOTE: There is a bug in the get_average_score function in the response module class WATCH OUT!
