CSC/ECE 517 Fall 2017/E17A8. Use a profiler to identify the problems / pages that take some time to load & fix them: Difference between revisions
| Line 47: | Line 47: | ||
The following is the rack-mini-profiler statistics for the page:- | The following is the rack-mini-profiler statistics for the page:- | ||
[[File:tre1.png]] | [[File:tre1.png]] | ||
| Line 52: | Line 53: | ||
The box which is seen in the leftmost corner is the MiniProfiler statistics. MiniProfiler gives a constant notification of how long each page takes to load. The miniprofiler statistics show the time taken to render the view as well as the corresponding SQL calls. | The box which is seen in the leftmost corner is the MiniProfiler statistics. MiniProfiler gives a constant notification of how long each page takes to load. The miniprofiler statistics show the time taken to render the view as well as the corresponding SQL calls. | ||
| Line 59: | Line 59: | ||
This image shows the time and the number of SQL calls which are required for each rendering. | This image shows the time and the number of SQL calls which are required for each rendering. | ||
| Line 69: | Line 65: | ||
Here as we can see the total number of SQL calls required for children_node_ng is 1123. This is causing the latency in the entire page by 10564.8 ms. These statistics helped us to identify the method which needs to be refactored. | Here as we can see the total number of SQL calls required for children_node_ng is 1123. This is causing the latency in the entire page by 10564.8 ms. These statistics helped us to identify the method which needs to be refactored. | ||
Revision as of 22:11, 6 November 2017
Optimization for page loading in Expertiza
Introduction
Expertiza is an online system that is used by students to view/submit assignments and review others' work. Expertiza also provides tools to visualize the scores and gauge the improvements made during the course semester. It also facilitates and monitors team projects. It is targeted at educational and non-profit organizations. The project is funded by the National Software Foundation (NSF), NCSU Learning in a Technology-Rich Environment (LITRE) program, the NCSU Faculty Center for Teaching and Learning, the NCSU STEM Initiative, and the Center for Advanced Computing and Communication.
Expertiza is an open-source project with the source code available as a public repository on GitHub. It is developed using Ruby on Rails and is increasingly becoming robust thanks to the innumerable bugs being fixed by the community. The project has a micro-blog on SourceForge where the developer community report bugs and document updates.
Task Description
1) Identifying the Expertiza pages which take time to load using Rack-mini-profiler and Flamegraphs.
2) Propose fixes which would improve the Expertiza project.
3) Optimizing the view, models and controllers for few of these corresponding fixes to improve the load time of these pages.
Gems Installed
- rack-mini-profiler :- Middleware that displays speed badge for every html page. Designed to work both in production and in development
- flamegraphs :- Flame graphs are a visualization of profiled software, allowing the most frequent code-paths to be identified quickly and accurately.
- stackprof:-A sampling call-stack profiler for ruby 2.1+.Downloaded as a dependency for rack-mini-profiler.
- fast_stack :-fast_stack is dynamically resizable data structure optimized for fast iteration over the large arrays of similar elements avoiding memory fragmentation.
Pages which needs to be optimized
1)expertiza.ncsu.edu/tree_display/list
2)expertiza.ncsu.edu/review_mapping/response_report
3)expertiza.ncsu.edu/grades/view
4)expertiza.ncsu.edu/users/list
Approach
In order to optimize, we need to understand the factors which are causing the lag. This can be identified by using the flamegraph generation method and rack-mini-profiler statistics. The statistics generated by rack miniprofiler help us to understand the time taken by each component to get loaded. From these statistics, we can identify the model/controller/view/database query which is causing this latency. From here, we can identify the methods which need to be refactored in order to optimize the webpage rendering.
Identification of pages
Analysis of page 1: expertiza.ncsu.edu/tree_display/list
FlameGraph Statistics
The following is the flamegraph for this page:-
The X axis of the FlameGraph represents the time taken to load the page. It can give a clear picture of where the expertiza page is getting bogged down. The widest layers take the longest to run. They’re the areas one should look into, because speeding them up could have the biggest impact. As we can see over here, most of the time taken over here is in the controller action.
MiniProfiler Statistics
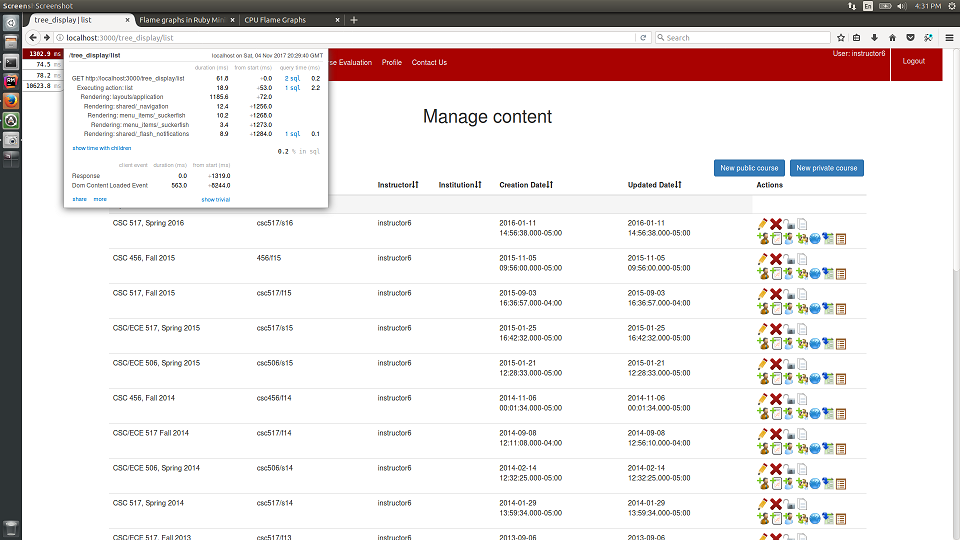
The following is the rack-mini-profiler statistics for the page:-
The box which is seen in the leftmost corner is the MiniProfiler statistics. MiniProfiler gives a constant notification of how long each page takes to load. The miniprofiler statistics show the time taken to render the view as well as the corresponding SQL calls.
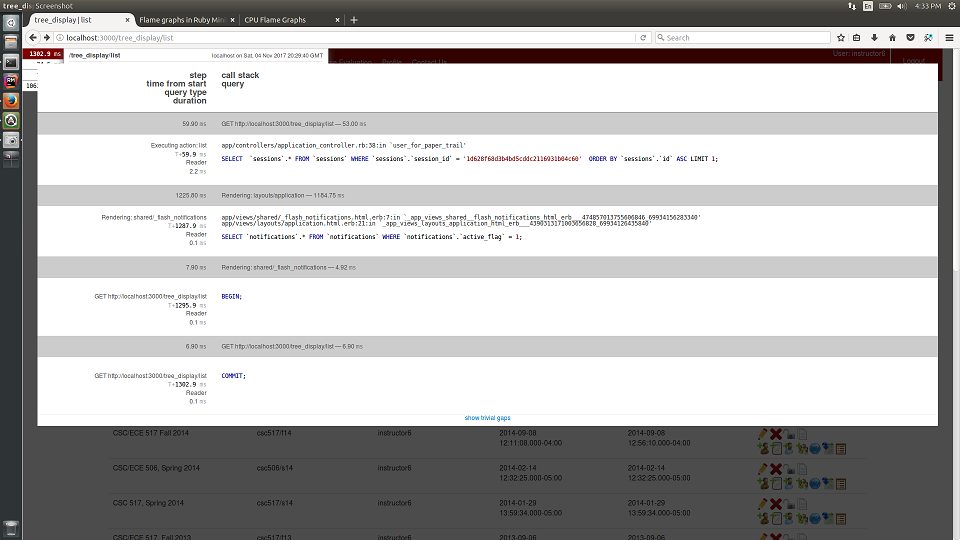
This image shows the time and the number of SQL calls which are required for each rendering.
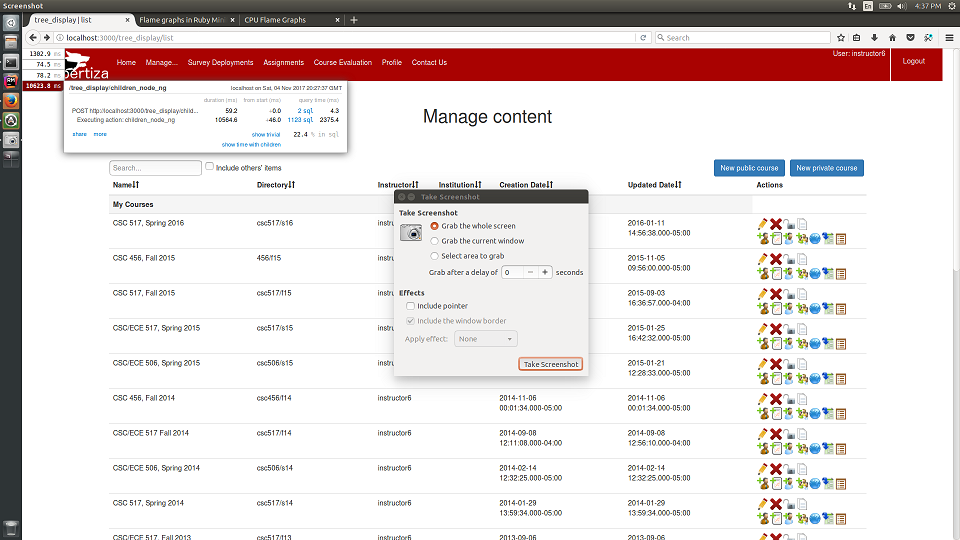
Here as we can see the total number of SQL calls required for children_node_ng is 1123. This is causing the latency in the entire page by 10564.8 ms. These statistics helped us to identify the method which needs to be refactored.
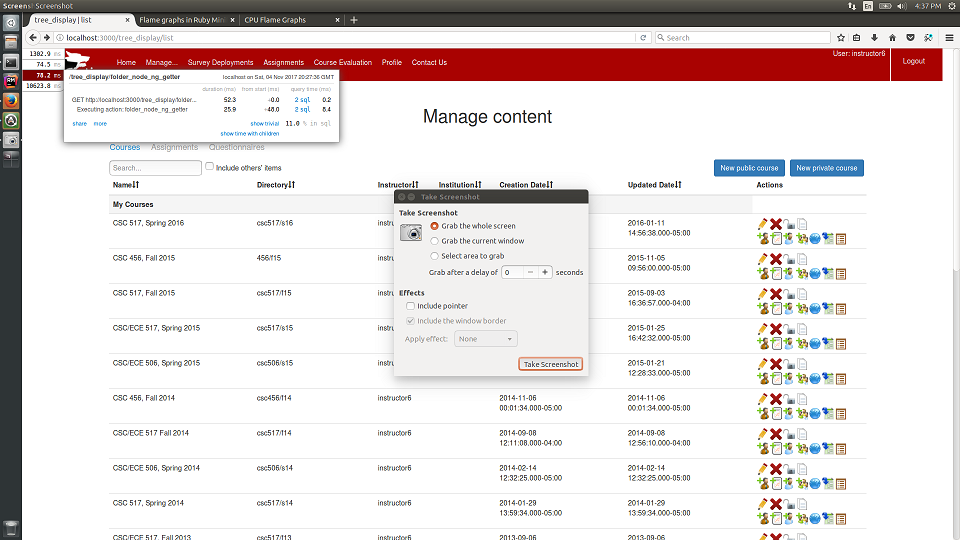
The total number of SQL calls required for 2 components here is 2 each. Hence we do not need to refactor this component.
Identified Component causing the delay
tree_display_controller
The following methods are consuming most of the time in this code :-
1)update_fnode_children
2)initialize_fnode_update_children
3)children_node_ng
These methods are from line 172-201 in this controller.
Proposed Solution
The time taken to load the page is high due to the time taken for the action children_node_ng. The time taken to execute it is 10564.8 milliseconds. This is due to the 1123 SQL calls which are performed in the given action. This delay can be reduced by reducing the total number of SQL calls, which can be reduced by identifying the methods causing this delay as well as by refactoring the code. The solution is to refactor the code which has been attached below to improve the time taken to perform this action.
 def update_fnode_children(fnode, tmp_res)
   # fnode is short for foldernode which is the parent node
   # ch_nodes are childrens
   # cnode = fnode.get_children("created_at", "desc", 2, nil, nil)
   ch_nodes = fnode.get_children(nil, nil, session[:user].id, nil, nil)
   tmp_res[fnode.get_name] = ch_nodes
 end
 # initialize parent node and update child nodes for it
 def initialize_fnode_update_children(params, node, tmp_res)
   fnode = (params[:reactParams][:nodeType]).constantize.new
   node.each do |a|
   fnode[a[0]] = a[1]
 end
   update_fnode_children(fnode, tmp_res)
   end
 # for child nodes
 def children_node_ng
   child_nodes = child_nodes_from_params(params[:reactParams][:child_nodes])
   tmp_res = {}
   child_nodes.each do |node|
   initialize_fnode_update_children(params, node, tmp_res)
 end
   res = res_node_for_child(tmp_res)
   respond_to do |format|
   format.html { render json: res }
   end
   end
