CSC/ECE 517 Fall 2013/ch1 1w12 vn: Difference between revisions
| (67 intermediate revisions by 2 users not shown) | |||
| Line 1: | Line 1: | ||
= Debugging in Ruby on Rails = | = Debugging in Ruby on Rails = | ||
[[File:debuggingrails.jpg|frame| | [[File:debuggingrails.jpg|frame|Debugging is twice as hard as writing the code in the first place. Therefore, if you write the code as cleverly as possible, you are, by definition, not smart enough to debug it. — Brian W. Kernighan<ref>http://www.uplifted.net/wp-content/uploads/2013/05/debugging.jpg</ref><ref> http://blogs.msdn.com/b/alfredth/archive/2009/01/08/are-you-smart-enough-to-debug-your-own-code.aspx</ref>]] | ||
__TOC__ | __TOC__ | ||
= Introduction = | = Introduction = | ||
[http://en.wikipedia.org/wiki/Ruby_on_Rails Rails] is an [http://en.wikipedia.org/wiki/Open_source open-source] [http://en.wikipedia.org/wiki/Web_application_frameworkweb web application framework] which | [http://en.wikipedia.org/wiki/Ruby_on_Rails Rails] is an [http://en.wikipedia.org/wiki/Open_source open-source] [http://en.wikipedia.org/wiki/Web_application_frameworkweb web application framework] which runs on [http://en.wikipedia.org/wiki/Ruby_%28programming_language%29 Ruby programming language]. With its huge set of [http://en.wikipedia.org/wiki/RubyGems gems] and support for [http://en.wikipedia.org/wiki/Model%E2%80%93view%E2%80%93controller MVC architecture], it provides an easy and clean approach for creating pages, talking to web server and dealing with databases. Debugging is always an important part of any application development for which Rails provides a tremendously good support despite being an [http://en.wikipedia.org/wiki/Interpreted_language interpreted language]. | ||
= Debugging Options = | = Debugging Options = | ||
| Line 13: | Line 14: | ||
== Debug Helpers == | == Debug Helpers == | ||
One of the easiest ways to [http://en.wikipedia.org/wiki/Debugging debugging] is to simply output the value of different variables which provides us the first look into what could be going wrong. This could be done in all of [http://en.wikipedia.org/wiki/Model%E2%80%93view%E2%80%93controller models, views and controllers]. Rails provides three methods-debug, to_yaml and inspect to achieve this task. These methods create human-readable data from any | One of the easiest ways to [http://en.wikipedia.org/wiki/Debugging debugging] is to simply output the value of different variables which provides us the first look into what could be going wrong. This could be done in all of [http://en.wikipedia.org/wiki/Model%E2%80%93view%E2%80%93controller models, views and controllers]. Rails provides three methods-debug, to_yaml and inspect to achieve this task. These methods create human-readable data from any Ruby object.<ref> http://ruby-doc.org/core-2.0.0/Object.html </ref> The examples below show the output when these methods are used in a view. | ||
{| class="wikitable" | {| class="wikitable" | ||
| Line 40: | Line 41: | ||
== Logger == | == Logger == | ||
Logger | Logger class in Ruby helps us log information at runtime . Depending on what we choose to save in the [http://en.wikipedia.org/wiki/Logfile log file], it can give us a variety of information such as what [http://en.wikipedia.org/wiki/SQL SQL] queries were sent to databases, methods executed on the controller, attributes of the controller. The default logger for Rails is ActiveSupport::Logger which creates a file(eg. development.log for development environment) under log/ directory.<ref> http://www.ruby-doc.org/stdlib-1.9.3/libdoc/logger/rdoc/Logger.html</ref> | ||
There are six logging levels supported by Logger class. | There are six logging levels supported by Logger class.<ref> http://railscasts.com/episodes/56-the-logger</ref> | ||
{| class="wikitable" | {| class="wikitable" | ||
|- | |- | ||
| Line 79: | Line 80: | ||
The different logging levels | The different logging levels determine the importance of the message and whether a message is logged or not depends on the current severity level set for an environment. Logger class logs all the messages for which severity level is same or above the current level set. The default logger level for development and production environment is debug and info respectively.<ref> http://rubylearning.com/satishtalim/ruby_logging.html </ref> | ||
{| class="wikitable" | {| class="wikitable" | ||
| Line 128: | Line 129: | ||
== Debugger Gem == | == Debugger Gem == | ||
[http://en.wikipedia.org/wiki/Debugger Debugger] gem provides a [http://en.wikipedia.org/wiki/Command-line_interface command-line interface] for debugging Rails applications step by step as opposed to just logging information which we have discussed so far. With the help of debugger gem, user can put | [http://en.wikipedia.org/wiki/Debugger Debugger] gem provides a [http://en.wikipedia.org/wiki/Command-line_interface command-line interface] for debugging Rails applications step by step as opposed to just logging information which we have discussed so far. With the help of debugger gem, user can put breakpoints, go through code step-wise, inspect contents of variables. The section below provides basic steps to install and use debugger.<ref> https://github.com/cldwalker/debugger </ref> | ||
* '''Installation''' | |||
Run the following command in the command window/terminal. | Run the following command in the command window/terminal. | ||
$ gem install debugger | $ gem install debugger | ||
* '''Invoke debugger''' | |||
User can invoke debugger from inside the code by calling debugger method. | User can invoke debugger from inside the code by calling debugger method. | ||
[[File:Debugger_put.jpg|frame|none|Calling debugger method]] | [[File:Debugger_put.jpg|frame|none|Calling debugger method]] | ||
* '''Start Web Server''' | |||
Start web server in a separate window using --debugger option | Start web server in a separate window using --debugger option | ||
$rails server --debugger | $rails server --debugger | ||
| Line 148: | Line 149: | ||
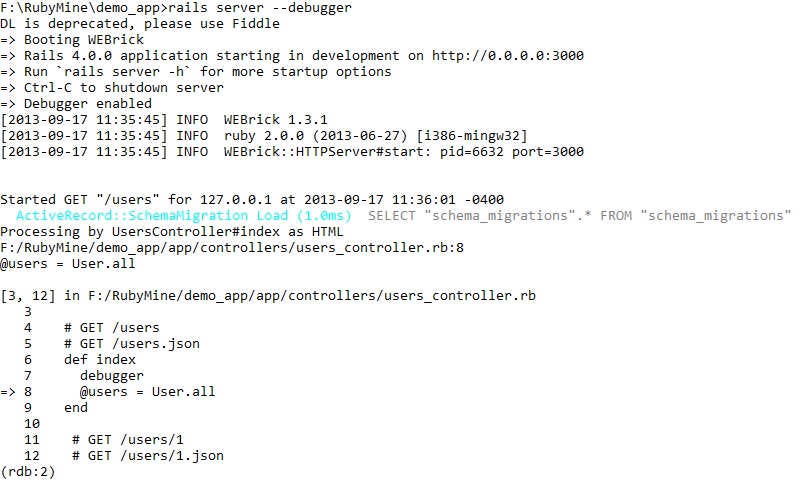
[[File:ServerStart.jpg|frame|none|Notice ''Debugger enabled'' message]] | [[File:ServerStart.jpg|frame|none|Notice ''Debugger enabled'' message]] | ||
* '''Execute Code''' | |||
Execute the code as usually and as soon as it comes across debugger method, the code execution will stop and wait for further instructions from the user. The arrow shows where in code has debugger currently stopped. | Execute the code as usually and as soon as it comes across debugger method, the code execution will stop and wait for further instructions from the user. The arrow shows where in code has debugger currently stopped. | ||
[[File:Breakpointhit.jpg|frame|none|The window displays 10 lines of code around the line where debugger has stopped]] | [[File:Breakpointhit.jpg|frame|none|The window displays 10 lines of code around the line where debugger has stopped]] | ||
* '''Commands''' | |||
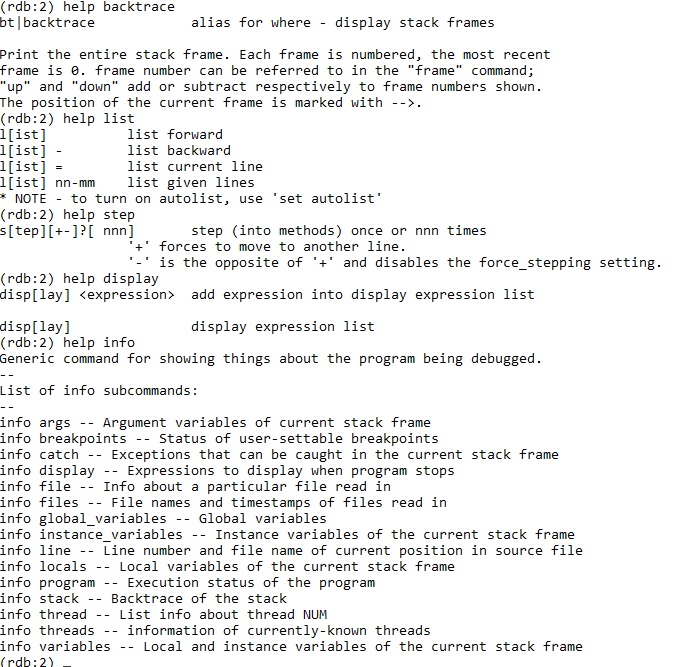
Enter help on the command prompt to find all the available commands user can use at this point. | Enter help on the command prompt to find all the available commands user can use at this point. | ||
| Line 162: | Line 163: | ||
For further information about a command, use the command | For further information about a command, use the command | ||
$ help < | $ help <command> | ||
[[File:helpcommands.jpg|frame|none|Help command usage]] | [[File:helpcommands.jpg|frame|none|Help command usage]] | ||
| Line 168: | Line 169: | ||
== Ruby-debug Gem == | == Ruby-debug Gem == | ||
This is debugger for | This is the debugger for Ruby v1.8 and ruby-debug19 is for Ruby 1.9. It checks what is going on inside the code of a Ruby program. We can use rdebug to invoke Ruby program by a debugger. Ruby-debug has four main kinds of features for finding bug<ref> http://bashdb.sourceforge.net/ruby-debug.html</ref><ref>http://blog.wyeworks.com/2011/11/1/ruby-1-9-3-and-ruby-debug/</ref>: | ||
#Depict anything that seems doubtful to affect your program after starting the script | #Depict anything that seems doubtful to affect your program after starting the script | ||
#Specify stop on the script at certain conditions. | #Specify stop on the script at certain conditions. | ||
#After the script has stopped, examine the results. | #After the script has stopped, examine the results. | ||
#Modify your script to correct the bug. | #Modify your script to correct the bug. | ||
Ruby-debug’s prompt is (rdb:n)where n is the thread number. Steps to be followed to use ruby-debug are mentioned below : | Ruby-debug’s prompt is (rdb:n) where n is the thread number. Steps to be followed to use ruby-debug are mentioned below : | ||
* Install debugger gem : | * Install debugger gem : | ||
| Line 182: | Line 183: | ||
require ‘ruby-debug’ | require ‘ruby-debug’ | ||
* | * Go to the command prompt and and write 'rdebug filename' where filename is the ruby file which you want to debug. | ||
* Now, a debugger prompt will be opened, there are several commands which we can use to further examine our code: | |||
#list :Prints 10 lines centered around the current line(default). We can change this by "set listsize" command. | |||
#step :Runs the script one executable unit | |||
#p,var, display :Prints and watch the value of a variable. To stop displaying, we use ‘undisplay_variableNumber’. | |||
#q, exit :Exit the debugger | |||
* | * Use ‘help’ for available commands. We can also get a list of directives with "help", or "help backtrace" for the usage of specific directive. | ||
Some useful commands are mentioned below : | |||
{| class="wikitable" | {| class="wikitable" | ||
|- | |- | ||
! style="width:30%;"|Command | ! style="width:30%;"|Command | ||
! style="width: | ! style="width:70%;"|Explanation | ||
|- style="vertical-align:top;" | |- style="vertical-align:top;" | ||
| Backtrace | | Backtrace | ||
| Line 197: | Line 203: | ||
|- style="vertical-align:top;" | |- style="vertical-align:top;" | ||
| Thread | | Thread | ||
| | | list the ongoing thread, its status. | ||
|- style="vertical-align:top;" | |- style="vertical-align:top;" | ||
| | | Info breakpoints _n or info break _n | ||
| | | list breakpoints | ||
|- style="vertical-align:top;" | |- style="vertical-align:top;" | ||
| | | Restart | ||
| | | to start the process again | ||
|} | |} | ||
Some other useful commands are ‘exit’, ‘finish’, | Some other useful commands are ‘exit’, ‘finish’,'break', ‘continue’, ‘next’, ‘set autoeval’, 'private_methods'. | ||
== Pry Gem == | |||
Pry is a runtime developer console and an alternative to [http://en.wikipedia.org/wiki/Interactive_Ruby_Shell IRB]. It provides many features for debugging code easily such as syntax highlighting, code indentation, ability to check source code or documentation without interrupting the current session. Pry solves the problem of indentation in IRB by resetting the terminal output as soon as a new line is entered.<ref>https://github.com/pry/pry</ref><ref>http://pryrepl.org/</ref><ref>http://rubygems.org/gems/pry</ref> | |||
== Pry | Steps to use Pry are as mentioned below: | ||
* '''Install Pry''' | |||
Include the following in gemfile | |||
gem 'pry', :group => :development | |||
gem 'pry-rails', :group => :development | |||
Run the bundle install command | |||
$bundle install | |||
* '''Change IRB console to Pry Console''' | |||
For a development environment, add this at the end of development.rb(add the code to corresponding files in other environment). | |||
silence_warnings do | |||
require 'pry' | |||
IRB = Pry | |||
end | |||
* '''Start Rails server''' | |||
Start rails server by typing ''rails server'' at command prompt. | |||
[[File:railsserver.jpg|frame|none|Start Rails server]] | |||
Pry | * '''Start a Pry session''' | ||
Add binding.pry where we want to invoke Pry in the code. | |||
[[File:prysetup.jpg|frame|none|Invoke Pry in the code]] | |||
* | * '''Execute code''' | ||
Execute the code by loading the Rails website in browser. The execution stops when it encounters binding.pry in the code. | |||
[[File:breakpointpry.jpg|frame|none|The arrow shows where in code are we currently]] | |||
* | * '''Show the source code/documentation of a method''' | ||
show-method #or | show-method #or | ||
show –doc | show –doc | ||
* | * '''Move out of a breakpoint''' | ||
CTRL+D | CTRL+D | ||
* '''Other Commands''' | |||
---- | |||
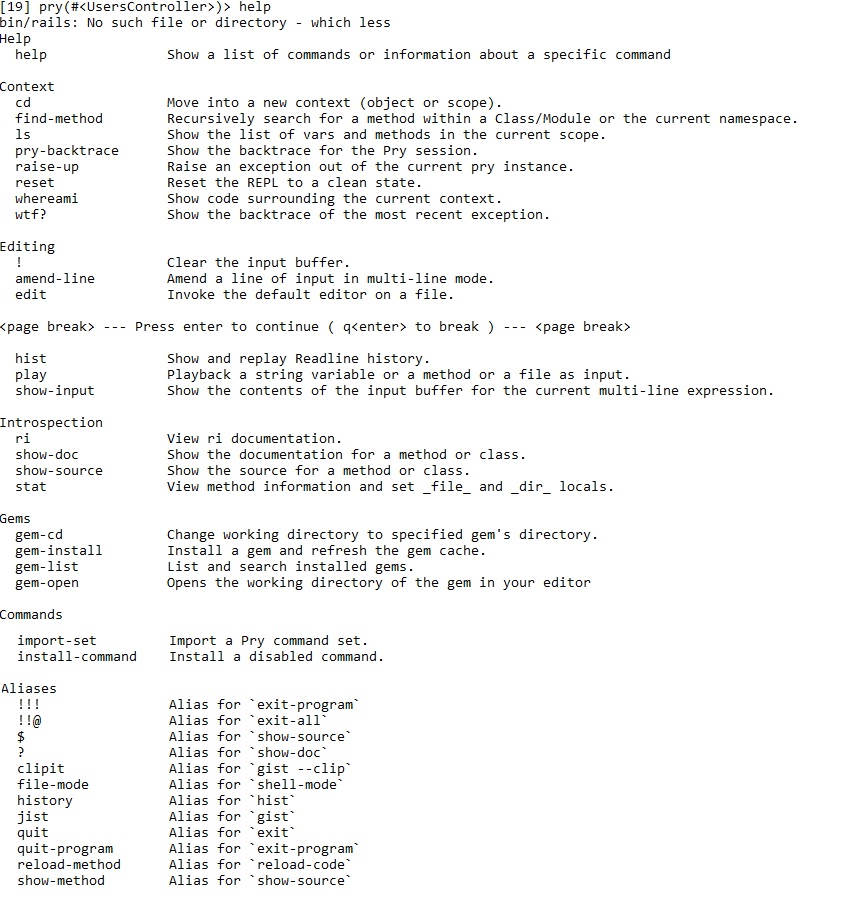
A list of commands supported by Pry can be obtained by typing ''help'' on the command shell.<ref> https://github.com/pry/pry/wiki/Command-system#wiki-Help_command</ref> | |||
[[File:prycommandslist.jpg|frame|none|List of commands]] | |||
[[File:prycommand1.jpg|frame|none|Running a sample command]] | |||
== Graphical Debugger == | == Graphical Debugger == | ||
Rubymine, a commercial IDE by JetBrains, has a graphical debugger for ruby and rails code. It provides important and useful features such as smart breakpoints, dedicated view for watches and stack, expression evaluator, etc. Some of the key features related to debugging are presented below. | [http://en.wikipedia.org/wiki/RubyMine Rubymine], a commercial [http://en.wikipedia.org/wiki/Integrated_development_environment IDE] by JetBrains, has a graphical debugger for ruby and rails code. It provides important and useful features such as smart breakpoints, dedicated view for watches and stack, expression evaluator, etc. Some of the key features related to debugging are presented below.<ref>http://www.jetbrains.com/ruby/features/ruby_debugger.html</ref><ref>https://code.google.com/p/rudebug/</ref> | ||
< | |||
* '''Options''' | * '''Options''' | ||
Rubymine debugger provides a lot of other options for debugging. | Rubymine debugger provides a lot of other options for debugging. | ||
[[File:Rubymineoptions_rm.jpg|frame|none|Rubymine Run window]] | [[File:Rubymineoptions_rm.jpg|frame|none|Rubymine Run window]] | ||
* '''Breakpoint''' | * '''Breakpoint''' | ||
One can put breakpoint by simply clicking on the start of the line in the window or pressing Ctrl+Shift+F8. Breakpoint feature highlights the corresponding line in the code. | One can put breakpoint by simply clicking on the start of the line in the window or pressing Ctrl+Shift+F8. Breakpoint feature highlights the corresponding line in the code. | ||
[[File:Breakpoint_rm.jpg|frame|none|Creating breakpoint which highlights the corresponding line in the code]] | [[File:Breakpoint_rm.jpg|frame|none|Creating breakpoint which highlights the corresponding line in the code]] | ||
* '''Frames, Variables and Watches''' | * '''Frames, Variables and Watches''' | ||
Rubymine debugger shows a separate window for frames, variables and watches when the execution hits a breakpoint. User can look in the corresponding window for more information. | Rubymine debugger shows a separate window for frames, variables and watches when the execution hits a breakpoint. User can look in the corresponding window for more information. | ||
[[File:Breakpointreached_rm.jpg|frame|none|Rubymine IDE when code execution hits a breakpoint. Notice the different windows for frames, variables and watches]] | [[File:Breakpointreached_rm.jpg|frame|none|Rubymine IDE when code execution hits a breakpoint. Notice the different windows for frames, variables and watches]] | ||
* '''Evaluate code and expressions''' | * '''Evaluate code and expressions''' | ||
Users can type in expression or code and evaluate it when the breakpoint is hit or on the fly. | Users can type in expression or code and evaluate it when the breakpoint is hit or on the fly. | ||
| Line 282: | Line 307: | ||
{| class="wikitable" | {| class="wikitable" | ||
|- | |- | ||
! style="width: | ! style="width:10%;"|Debug Option | ||
! style="width: | ! style="width:10%;"|Free/Commercial | ||
! style="width: | ! style="width:30%;"|Comments | ||
|- style="vertical-align:top;" | |- style="vertical-align:top;" | ||
| Debug Helpers | | Debug Helpers | ||
| Line 298: | Line 323: | ||
| Support for outputting the contents of object. Tagging feature quite useful for multi-user/large applications. | | Support for outputting the contents of object. Tagging feature quite useful for multi-user/large applications. | ||
|- style="vertical-align:top;" | |- style="vertical-align:top;" | ||
| | | Debugger gem | ||
| Free | | Free | ||
| Support for step-wise command-line debugging. Lots of advanced features available. | | Support for step-wise command-line debugging. Lots of advanced features available. | ||
|- style="vertical-align:top;" | |- style="vertical-align:top;" | ||
| debug | | Ruby-debug gem | ||
| Free | | Free | ||
| . | | Support for step-wise command-line debugging. Lots of advanced features available. | ||
|- style="vertical-align:top;" | |- style="vertical-align:top;" | ||
| | | Pry gem | ||
| Free | | Free | ||
| . | | Support for step-wise command-line debugging. Lots of advanced commands available for better debugging. | ||
|- style="vertical-align:top;" | |- style="vertical-align:top;" | ||
| Rubymine | | Rubymine | ||
| Commercial | | Commercial | ||
| Support for step-wise graphical debugging. Lots of advanced features available. | | Support for step-wise graphical debugging. Lots of advanced features available. | ||
|- style="vertical-align:top;" | |||
|} | |} | ||
= | = See Also = | ||
The information provided in the sections above are mostly effective for general debugging in Rails. There are more options available which provide other useful features for debugging | The information provided in the sections above are mostly effective for general debugging in Rails. However, it's not an exhaustive list of gems/tools one could use. There are more options available which provide other useful features for ruby/rails debugging. | ||
* [https://github.com/charliesome/better_errors better_errors ] | |||
* [https://github.com/nixme/jazz_hands jazz_hands ] | |||
* [https://github.com/Zorros/debugger-rails debugger-rails ] | |||
For more specific cases such as memory leak debugging, other choices | For more specific cases such as memory usage profiling, memory leak debugging, there are other choices available. | ||
* [http://valgrind.org/ Valgrind] | |||
* [https://github.com/brynary/rack-bug Rack-Bug] | |||
* [https://github.com/noahd1/oink Oink] | |||
* [https://github.com/binarylogic/memorylogic/tree/master Memory Logic] | |||
=References= | =References= | ||
<references /> | <references /> | ||
=External Links= | |||
[http://www.csc.ncsu.edu/ Computer Science, NC State] | |||
Latest revision as of 19:15, 18 September 2013
Debugging in Ruby on Rails
Introduction
Rails is an open-source web application framework which runs on Ruby programming language. With its huge set of gems and support for MVC architecture, it provides an easy and clean approach for creating pages, talking to web server and dealing with databases. Debugging is always an important part of any application development for which Rails provides a tremendously good support despite being an interpreted language.
Debugging Options
Rails provides a range of options to make debugging easier. Some of these options have been discussed in the sections below. <ref>http://guides.rubyonrails.org/debugging_rails_applications.html</ref>
Debug Helpers
One of the easiest ways to debugging is to simply output the value of different variables which provides us the first look into what could be going wrong. This could be done in all of models, views and controllers. Rails provides three methods-debug, to_yaml and inspect to achieve this task. These methods create human-readable data from any Ruby object.<ref> http://ruby-doc.org/core-2.0.0/Object.html </ref> The examples below show the output when these methods are used in a view.
| Code | Output |
|---|---|
| <%= @users.to_yaml %> | --- - !ruby/object:User attributes: id: 2 name: Jimmy Page email: jimmy.page@gmail.com created_at: 2013-09-14 02:37:16.322638000 Z updated_at: 2013-09-16 20:38:04.250678000 Z |
| <%= @users.inspect %> | #<ActiveRecord::Relation [#<User id: 2, name: "Jimmy Page", email: "jimmy.page@gmail.com", created_at: "2013-09-14 02:37:16", updated_at: "2013-09-16 20:38:04">]> |
| <%= debug @users %> |
--- - !ruby/object:User attributes: id: 2 name: Jimmy Page email: jimmy.page@gmail.com created_at: 2013-09-14 02:37:16.322638000 Z updated_at: 2013-09-16 20:38:04.250678000 Z |
Logger
Logger class in Ruby helps us log information at runtime . Depending on what we choose to save in the log file, it can give us a variety of information such as what SQL queries were sent to databases, methods executed on the controller, attributes of the controller. The default logger for Rails is ActiveSupport::Logger which creates a file(eg. development.log for development environment) under log/ directory.<ref> http://www.ruby-doc.org/stdlib-1.9.3/libdoc/logger/rdoc/Logger.html</ref> There are six logging levels supported by Logger class.<ref> http://railscasts.com/episodes/56-the-logger</ref>
| Error Name | Error Level | Description |
|---|---|---|
| UNKNOWN | 5 (highest) | An unknown message that should always be logged. |
| FATAL | 4 | An error that cannot be handled and results in a program crash |
| ERROR | 3 | An error that cannot be handled |
| WARN | 2 | A warning |
| INFO | 1 | Information about system operation |
| DEBUG | 0 (lowest) | Information for developers |
Examples
logger.info "Users information successfully displayed"
logger.debug "Users contains #{@users}"
logger.fatal "The program could crash"
The different logging levels determine the importance of the message and whether a message is logged or not depends on the current severity level set for an environment. Logger class logs all the messages for which severity level is same or above the current level set. The default logger level for development and production environment is debug and info respectively.<ref> http://rubylearning.com/satishtalim/ruby_logging.html </ref>
| Purpose | Command/Method/Procedure |
|---|---|
| Change default log level | config.log_level = :info #in any environment initializer
Rails.logger.level = 0 #anywhere |
| Configure a new logger | config.logger = Logger.new(...)
User can pass STDOUT/STDERR or name of a file to the initializer depending on where the log messages need to be sent. The Logger class provides options which age the logfile when it reaches a certain size or time (daily/weekly/monthly etc). logger = Logger.new('development.log', 'daily')
|
| Clear log messages | rake log:clear |
| Display log file information on terminal window(UNIX) | tail -f log/development.log |
| Put custom messages for debug in models/controllers/views | logger.debug
logger.debug_variables |
| Put custom messages for debug in any other custom class | RAILS_DEFAULT_LOGGER |
| Change format of logger messages | Override method format_messages(level, time, progname, message) |
Tagged Logging
Debugging a large application could become cumbersome if user decides to log every minor information. Sure removing some of the low level messages could reduce clutter but it is not always an effective solution. Luckily, ActiveSupport::TaggedLogging class provides a way to filter log messages on the basis of tags which could be anything from subdomains to request ids. User can simply grep into or search log file(s) using tags and look for relevant results quickly.<ref> http://api.rubyonrails.org/classes/ActiveSupport/TaggedLogging.html </ref>
logger = ActiveSupport::TaggedLogging.new(Logger.new('logfile.log'))     #creates a new logger
logger.tagged("USR") { logger.info "User info obtained" }                #Logs as "[USR] User info obtained"
logger.tagged("USR", "Jimmy") { logger.info "Jimmy logged in" }          #Logs "[USR] [Jimmy] Jimmy logged in"
logger.tagged("USR") do
  logger.tagged("Jimmy") { logger.info "Jimmy there" }
  logger.info "USR there"
end
# logged as "[USR] [Jimmy] Jimmy there\n[USR] USR there\n"
Debugger Gem
Debugger gem provides a command-line interface for debugging Rails applications step by step as opposed to just logging information which we have discussed so far. With the help of debugger gem, user can put breakpoints, go through code step-wise, inspect contents of variables. The section below provides basic steps to install and use debugger.<ref> https://github.com/cldwalker/debugger </ref>
- Installation
Run the following command in the command window/terminal.
$ gem install debugger
- Invoke debugger
User can invoke debugger from inside the code by calling debugger method.

- Start Web Server
Start web server in a separate window using --debugger option
$rails server --debugger

- Execute Code
Execute the code as usually and as soon as it comes across debugger method, the code execution will stop and wait for further instructions from the user. The arrow shows where in code has debugger currently stopped.
- Commands
Enter help on the command prompt to find all the available commands user can use at this point.

For further information about a command, use the command
$ help <command>
Ruby-debug Gem
This is the debugger for Ruby v1.8 and ruby-debug19 is for Ruby 1.9. It checks what is going on inside the code of a Ruby program. We can use rdebug to invoke Ruby program by a debugger. Ruby-debug has four main kinds of features for finding bug<ref> http://bashdb.sourceforge.net/ruby-debug.html</ref><ref>http://blog.wyeworks.com/2011/11/1/ruby-1-9-3-and-ruby-debug/</ref>:
- Depict anything that seems doubtful to affect your program after starting the script
- Specify stop on the script at certain conditions.
- After the script has stopped, examine the results.
- Modify your script to correct the bug.
Ruby-debug’s prompt is (rdb:n) where n is the thread number. Steps to be followed to use ruby-debug are mentioned below :
- Install debugger gem :
gem install ruby-debug
- Go to config file and add below command :
require ‘ruby-debug’
- Go to the command prompt and and write 'rdebug filename' where filename is the ruby file which you want to debug.
- Now, a debugger prompt will be opened, there are several commands which we can use to further examine our code:
- list :Prints 10 lines centered around the current line(default). We can change this by "set listsize" command.
- step :Runs the script one executable unit
- p,var, display :Prints and watch the value of a variable. To stop displaying, we use ‘undisplay_variableNumber’.
- q, exit :Exit the debugger
- Use ‘help’ for available commands. We can also get a list of directives with "help", or "help backtrace" for the usage of specific directive.
Some useful commands are mentioned below :
| Command | Explanation |
|---|---|
| Backtrace | To check all the previous code. To move inside the trace, use frame_n_command |
| Thread | list the ongoing thread, its status. |
| Info breakpoints _n or info break _n | list breakpoints |
| Restart | to start the process again |
Some other useful commands are ‘exit’, ‘finish’,'break', ‘continue’, ‘next’, ‘set autoeval’, 'private_methods'.
Pry Gem
Pry is a runtime developer console and an alternative to IRB. It provides many features for debugging code easily such as syntax highlighting, code indentation, ability to check source code or documentation without interrupting the current session. Pry solves the problem of indentation in IRB by resetting the terminal output as soon as a new line is entered.<ref>https://github.com/pry/pry</ref><ref>http://pryrepl.org/</ref><ref>http://rubygems.org/gems/pry</ref>
Steps to use Pry are as mentioned below:
- Install Pry
Include the following in gemfile
gem 'pry', :group => :development
gem 'pry-rails', :group => :development
Run the bundle install command
$bundle install
- Change IRB console to Pry Console
For a development environment, add this at the end of development.rb(add the code to corresponding files in other environment).
silence_warnings do
 require 'pry'
 IRB = Pry
end
- Start Rails server
Start rails server by typing rails server at command prompt.

- Start a Pry session
Add binding.pry where we want to invoke Pry in the code.

- Execute code
Execute the code by loading the Rails website in browser. The execution stops when it encounters binding.pry in the code.

- Show the source code/documentation of a method
show-method      #or
show –doc
- Move out of a breakpoint
CTRL+D
- Other Commands
A list of commands supported by Pry can be obtained by typing help on the command shell.<ref> https://github.com/pry/pry/wiki/Command-system#wiki-Help_command</ref>
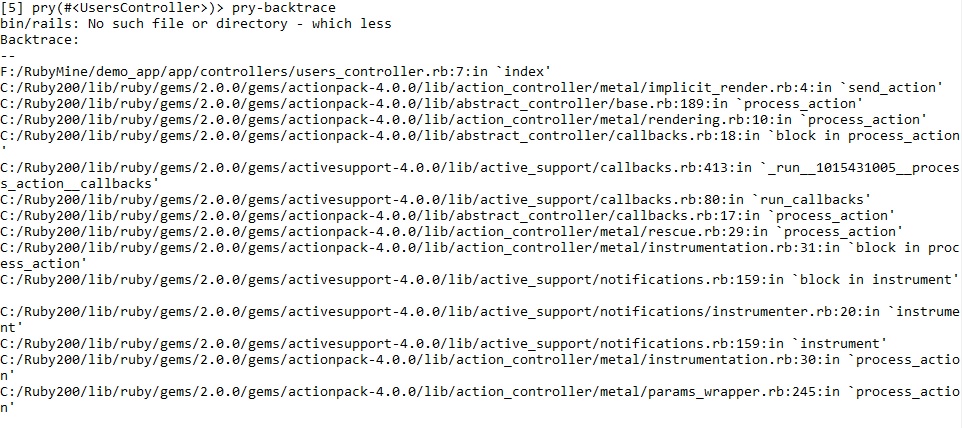
Graphical Debugger
Rubymine, a commercial IDE by JetBrains, has a graphical debugger for ruby and rails code. It provides important and useful features such as smart breakpoints, dedicated view for watches and stack, expression evaluator, etc. Some of the key features related to debugging are presented below.<ref>http://www.jetbrains.com/ruby/features/ruby_debugger.html</ref><ref>https://code.google.com/p/rudebug/</ref>
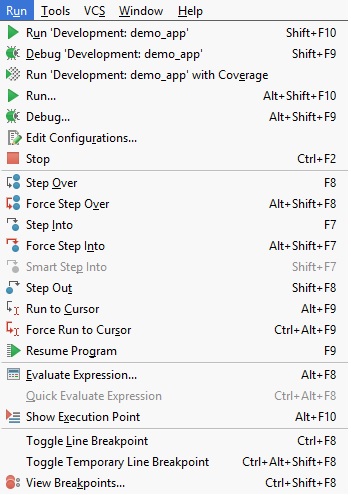
- Options
Rubymine debugger provides a lot of other options for debugging.
- Breakpoint
One can put breakpoint by simply clicking on the start of the line in the window or pressing Ctrl+Shift+F8. Breakpoint feature highlights the corresponding line in the code.

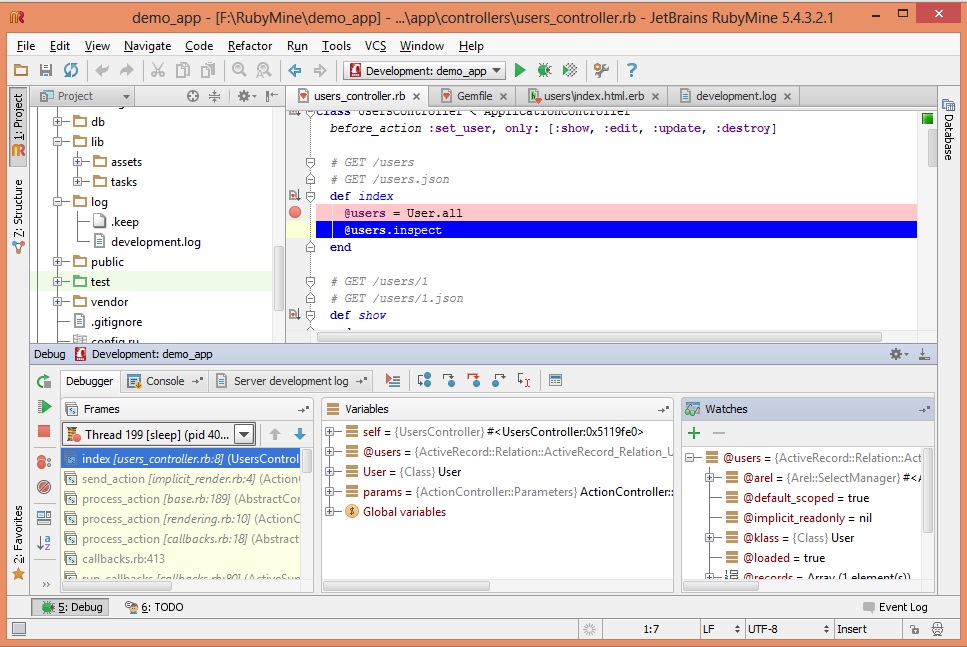
- Frames, Variables and Watches
Rubymine debugger shows a separate window for frames, variables and watches when the execution hits a breakpoint. User can look in the corresponding window for more information.
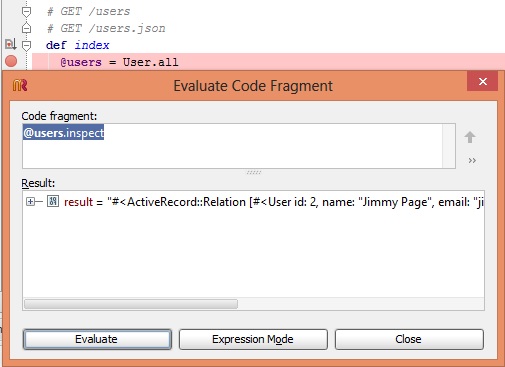
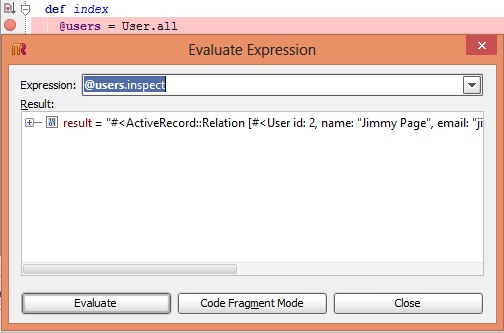
- Evaluate code and expressions
Users can type in expression or code and evaluate it when the breakpoint is hit or on the fly.
Analysis
As one can gather from the information provided in the previous sections, there are quite a few debugging options available to tackle bugs in Rails applications. Depending on the severity of bug encountered, one can simply choose to output object contents or debug stepwise. The choice also depends on whether the debugger is free or commercially available. Here is a brief analysis.
| Debug Option | Free/Commercial | Comments |
|---|---|---|
| Debug Helpers | Free | Inspect the contents of an object |
| Logger | Free | Support for outputting the contents of an object |
| Tagged Logging | Free | Support for outputting the contents of object. Tagging feature quite useful for multi-user/large applications. |
| Debugger gem | Free | Support for step-wise command-line debugging. Lots of advanced features available. |
| Ruby-debug gem | Free | Support for step-wise command-line debugging. Lots of advanced features available. |
| Pry gem | Free | Support for step-wise command-line debugging. Lots of advanced commands available for better debugging. |
| Rubymine | Commercial | Support for step-wise graphical debugging. Lots of advanced features available. |
See Also
The information provided in the sections above are mostly effective for general debugging in Rails. However, it's not an exhaustive list of gems/tools one could use. There are more options available which provide other useful features for ruby/rails debugging.
For more specific cases such as memory usage profiling, memory leak debugging, there are other choices available.
References
<references />