CSC/ECE 517 Fall 2017/E17A8. Use a profiler to identify the problems / pages that take some time to load & fix them: Difference between revisions
(→Links) |
|||
| (3 intermediate revisions by one other user not shown) | |||
| Line 126: | Line 126: | ||
1)Clone the git repository. | 1)Clone the git repository. | ||
2)Go to the commit on 3rd November(name: initial setup), this is the code which is originally provided by the professor and has not been modified. It however consists of the two gems required to check the loading time. | 2)Go to the commit on 3rd November (name: initial setup), this is the code which is originally provided by the professor and has not been modified. It however consists of the two gems required to check the loading time. | ||
3)To login as instructor :- | 3)To login as instructor :- | ||
| Line 147: | Line 147: | ||
* Project Demo : https://www.youtube.com/watch?v=qQi6yqbmST4&t=4s | * Project Demo : https://www.youtube.com/watch?v=qQi6yqbmST4&t=4s | ||
* Project Repository: https://github.com/sahildorwat/expertiza | * Project Repository: https://github.com/sahildorwat/expertiza | ||
* Pull request: https://github.com/expertiza/expertiza/pull/1122 | |||
* Github issue: https://github.com/expertiza/expertiza/issues/1121 | |||
Latest revision as of 03:32, 17 December 2017
Optimization for page loading in Expertiza
Introduction
Expertiza is an online system that is used by students to view/submit assignments and review others' work. Expertiza also provides tools to visualize the scores and gauge the improvements made during the course semester. It also facilitates and monitors team projects. It is targeted at educational and non-profit organizations. The project is funded by the National Software Foundation (NSF), NCSU Learning in a Technology-Rich Environment (LITRE) program, the NCSU Faculty Center for Teaching and Learning, the NCSU STEM Initiative, and the Center for Advanced Computing and Communication.
Expertiza is an open-source project with the source code available as a public repository on GitHub. It is developed using Ruby on Rails and is increasingly becoming robust thanks to the innumerable bugs being fixed by the community. The project has a micro-blog on SourceForge where the developer community report bugs and document updates.
Project Description
1) Identifying the Expertiza pages which take time to load using Rack-mini-profiler and Flamegraphs.
2) Propose fixes which would improve the Expertiza project.
3) Optimizing the view, models and controllers for few of these corresponding fixes to improve the load time of these pages.
Gems Installed
- rack-mini-profiler :- Middleware that displays speed badge for every html page. Designed to work both in production and in development.
- flamegraphs :- Flame graphs are a visualization of profiled software, allowing the most frequent code-paths to be identified quickly and accurately.
- stackprof :- A sampling call-stack profiler for ruby 2.1+.Downloaded as a dependency for rack-mini-profiler.
- fast_stack :- fast_stack is dynamically resizable data structure optimized for fast iteration over the large arrays of similar elements avoiding memory fragmentation.
- Kaminari :- A Scope & Engine based, clean, powerful, customizable and sophisticated paginator for modern web app frameworks and ORMs.
Pages which needs to be optimized
1) expertiza.ncsu.edu/grades/view?id=<ID of the team>
2) expertiza.ncsu.edu/users/list
Project Design
For the purpose of this project, experts in the expertiza domain are Instructors.
The following two patterns are implemented in the project -
1.MVC Pattern - The project is implemented in Ruby on Rails that uses MVC architecture. It separates an application’s data model, user interface, and control logic into three distinct components (model, view, and controller, respectively).
2.DRY Principle - We are trying to reuse the existing functionalities in Expertiza, thus avoiding code duplication. Whenever possible, code modification based on the existing classes, controllers, or tables will be done instead of creating the new one.
3.Optimization - In order to optimize, we need to understand the factors which are causing the lag. This can be identified by using the flamegraph generation method and rack-mini-profiler statistics.
Approach
To complete the given task, we identified the factors which are causing the lag. This was done by using flamegraph generation and rack-mini-profiler statistics. The statistics generated by rack miniprofiler helped us to understand the time taken by each component to get loaded. From these statistics, we identified the model/controller/view/database query which is causing this latency. From here, we identified the methods which needed to be implemented in order to optimize the webpage rendering.
Optimization approach for the pages:
- users/list :- The approach to reduce loading time on this page was by implementing pagination. Instead of displaying all users and their data all at once, we display a certain number of users on one page, and rest of the users can be viewed by accessing the later pages. This reduces loading time of the page by reducing the amount of data to be fetched.
- grades/view : Ajax must be used for the optimization. Currently, all the data for all the teams present is loaded when the webpage is accessed. Instead, data for particular teams can be loaded when the user clicks on the expand button for that particular team. Thus, data for each team should be loaded asynchronously with ajax.
Analysis of the pages
FlameGraph Statistics
The following is the flamegraph for this page:-
The X axis of the FlameGraph represents the time taken to load the page. It can give a clear picture of where the expertiza page is getting bogged down. The widest layers take the longest to run. They’re the areas one should look into, because speeding them up could have the biggest impact. As we can see over here, most of the time taken over here is in the controller action.
MiniProfiler Statistics
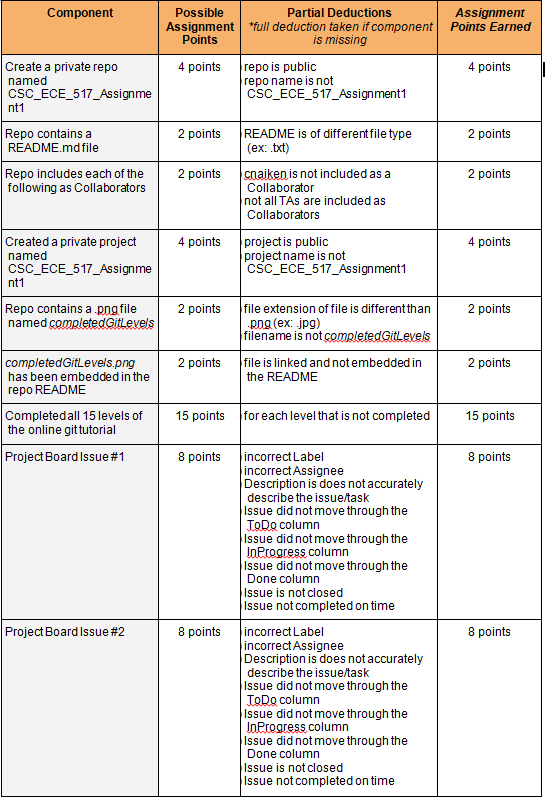
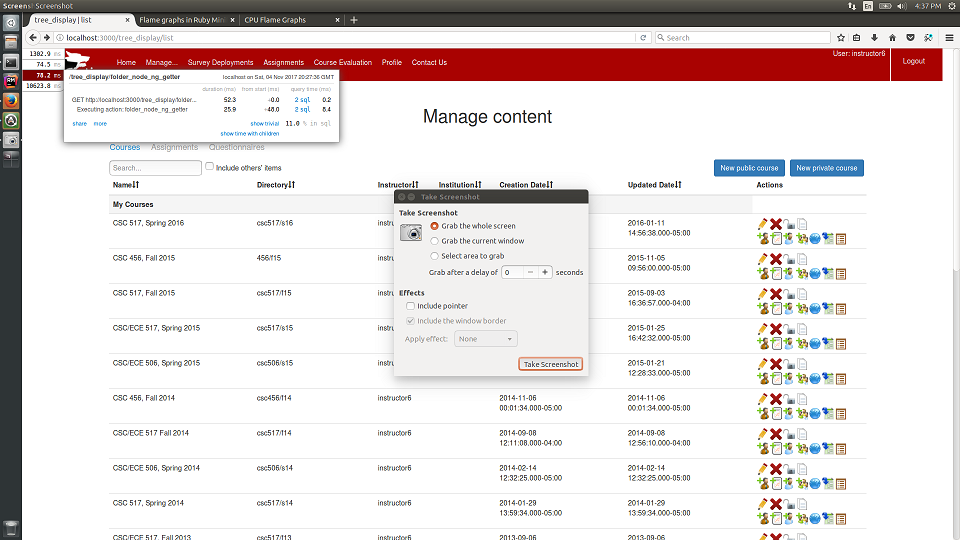
The following is the rack-mini-profiler statistics for the page:-
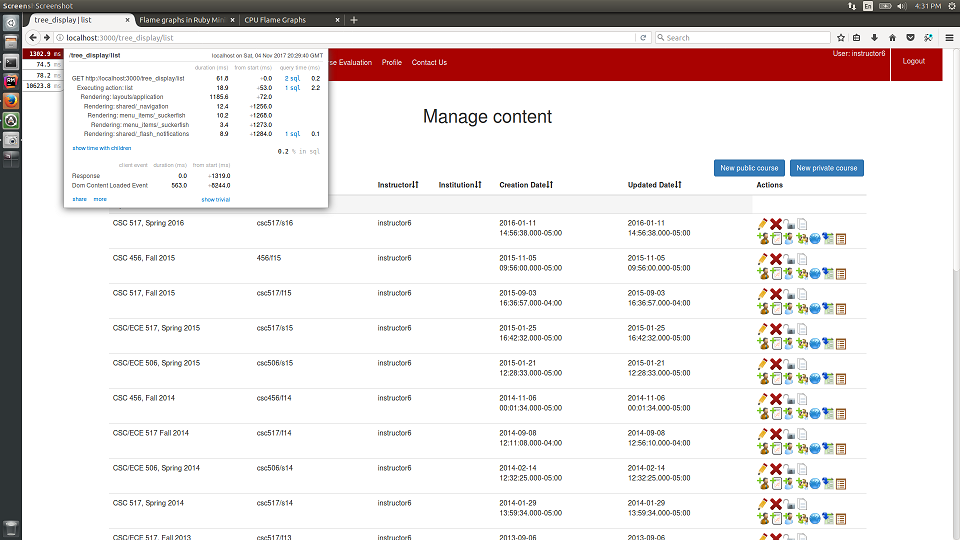
The box which is seen in the leftmost corner is the MiniProfiler statistics. MiniProfiler gives a constant notification of how long each page takes to load. The miniprofiler statistics show the time taken to render the view as well as the corresponding SQL calls.
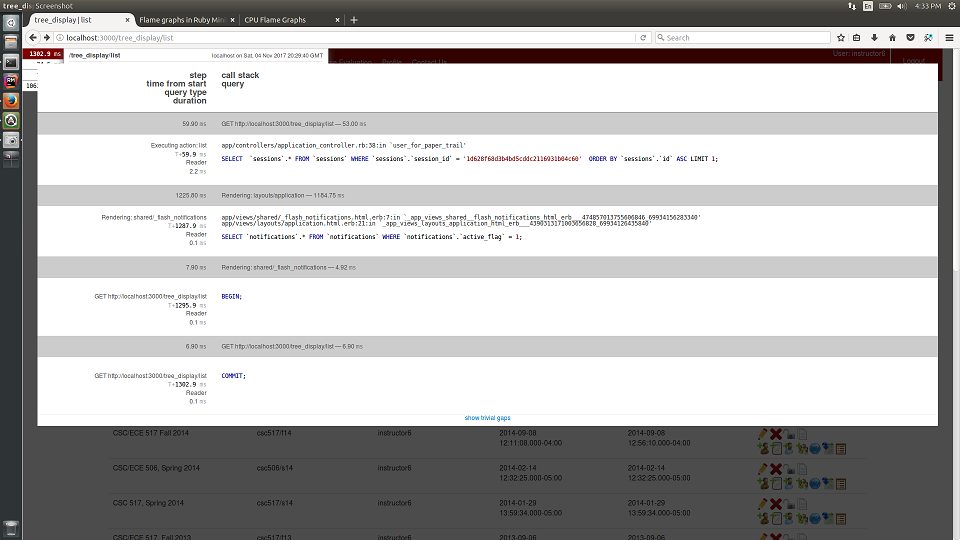
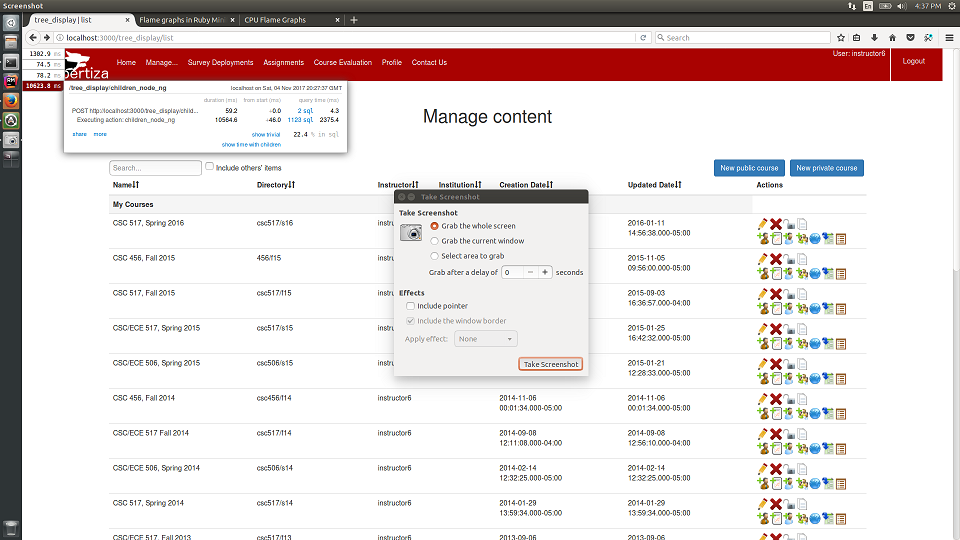
This image shows the time and the number of SQL calls which are required for each rendering.
Here as we can see the total number of SQL calls required for children_node_ng is 1123. This is causing the latency in the entire page by 10564.8 ms. These statistics helped us to identify the method which needs to be refactored.
The total number of SQL calls required for 2 components here is 2 each. Hence we do not need to refactor this component.
Solution
- users/list
The time taken to load the page was high because the server had to access through hundreds of rows in the database .The page was rendering the entire row of database at the same time. Pagination helped to split the database into manageable chunks of data.
Code added to app/controllers/users_controller.rb
 def list
   user = session[:user]
 	@users=Kaminari.paginate_array(user.get_user_list).page(params[:page])
 end
Code added to app/models/user.rb
<%= paginate @user %>
Code added to app/views/users/list.html.erb
<%= paginate @users %>
- grades/view
The grades/view is the page where the instructor accesses the grades statistics of each student. The reason for the slow down in the page is that the data for all the teams were loaded as soon as the page was loaded.The design of the page has an individual tab for each team, hence loading the entire data as soon as the page is loaded is quite redundant as the instructor needs to access the scores of each individual team at a given time. The solution to this problem is to access the individual team statistics from the database when the instructor clicks the tab specified for the particular individual. The existing code consists of a for loop in views/grades/_teams.html.erb, which renders the partial "views/grades/_tabbing.html.erb" which displays the data repeatedly. Instead, this partial could be rendered through AJAX or JQuery, whenever the expand button is clicked. This would save redundant loading of data and thus reduce the loading time of the page.
Issues faced during implementation of this solution:-
- While implementing this fix, we first created a controller method, which would render the required partial "views/grades/_tabbing.html.erb" when called.We also created a route for this controller method.
- We passed the required data through the Rails params hash. However, since one argument that needed to be passed (tscore) is a Hash, when it enters the params hash, it is getting converted to a String.
- We tried passing the hash as it is, but after doing this all the data in the hash is not retained, i.e. there is a loss of data.
- We also tried converting the String back into Hash by using the eval method, and to_unsafe_h method.
- However, these methods require the hash to be present in a normal form i.e. key value pairs.
- But our hash has values as Objects, thus these methods cannot be applied
- Thus, we are unable to access the data in the String-hash.
- If this could be done, then our approach would result in successfully decreasing the loading time of the webpage.
Test Plan
The project is based on optimizing the time required to load the pages which has been mentioned above,in order to test that there is an improvement in the time taken to load these pages one will have to compare the initial loading time and the time taken after the code has been modified.
Initial Setup for testing
1)Clone the git repository.
2)Go to the commit on 3rd November (name: initial setup), this is the code which is originally provided by the professor and has not been modified. It however consists of the two gems required to check the loading time.
3)To login as instructor :- Username :- instructor6 Password :- password
Testing
Check the time taken to load the page localhost:3000/tree_display/list on the left corner and compare the same for the latest pull. You will notice a substantial reduction in the loading time.
Automated Test
There can be no automated test for this program since the improvement in the performance is due to the inclusion of the pagination gem.
Hence testing if the pagination gem will work is equivalent to checking if rails is working.
As testing rails is not recommended no automated test is added for changes made.
Links
- Project Demo : https://www.youtube.com/watch?v=qQi6yqbmST4&t=4s
- Project Repository: https://github.com/sahildorwat/expertiza
- Pull request: https://github.com/expertiza/expertiza/pull/1122
- Github issue: https://github.com/expertiza/expertiza/issues/1121
