CSC/ECE 517 Fall 2013/ch1 1w11 sv: Difference between revisions
| (79 intermediate revisions by 2 users not shown) | |||
| Line 1: | Line 1: | ||
= Debugging Using Firebug = | = Debugging Using Firebug = | ||
Firebug is a | [[File:firebug.png|right]] | ||
Firebug is a Firefox browser add-on that puts together various web development tools to facilitate web development. It enables web developers to debug, edit and inspect websites' components like CSS, HTML, DOM, JavaScripts. Firebug is free and open source software distributed under the BSD License. Apart from providing debugging, Firebug is also used to analyse performance of websites. It is widely used in major companies such as Amazon, eBay, ThoughtWorks etc. by web developers to test and fix bugs in their code. | |||
__TOC__ | __TOC__ | ||
== Installation and Activation == | == Installation and Activation == | ||
Firebug can be installed as a Add-On/Plugin for Firefox. Firebug compatibility for different | Firebug can be installed as a Add-On/Plugin for Firefox. Firebug compatibility for different versions of Firefox can be looked [https://addons.mozilla.org/en-US/firefox/addon/firebug/ here]. A cross-browser version is in development. | ||
Following are the ways to activate Firebug | Following are the ways to activate Firebug | ||
| Line 16: | Line 18: | ||
== Debugging == | == Debugging == | ||
Firebug | Firebug provides different tabs to examine HTML(Markup), CSS(Styling), DOM(Document Object Model), Scripts, Net (Network Analysis) etc. This section briefly explains the various tools available by Firebug and how to use them to debug web applications. To start with debugging, you should right click on the browser and select "Inspect element with Firebug", which will show the Firebug panel. | ||
[[File:inspect element.png ]] | |||
=== HTML Debugging === | === HTML Debugging === | ||
---- | |||
---- | |||
Firebug can point any HTML element with precision. HTML elements' attributes and text can be created, deleted, or edited just by clicking them. The changes will be reflected immediately as one type. The below snapshot depicts the position of selected "h1" element in html. | |||
[[File:inspect_html_2.png]] | |||
Once an element is selected, you can change its value to see its affect on the page. These edits are not permanent. It just provide a kind of visual aid to web designer in enriching the look and feel of the page. The below snapshot depicts the editing of title. This change is applied immediately as you type. | |||
[[File:Edit_title.png]] | |||
=== CSS Debugging === | === CSS Debugging === | ||
---- | ---- | ||
---- | |||
Firebug shows the styles that cascade together for each element. Style rules are viewed in the order of precedence. The overridden properties are struck out. Eg if body have style {text-color : red;}. Every element in body follow this style(known as cascading of styles). But if an element (element1) have its own style like .element1 {text-color :blue;} then the body style is struck out and the text in element1 are in blue color. Thus inspecting styles of any element is very easy with firebug. | |||
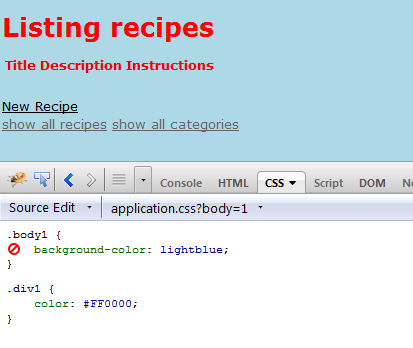
The style of any html element can be tweaked and checked in real-time. In the below snapshot, background-color of .body1 is changed to blue. This change is applied immediately. But, as mentioned earlier, these tweaks are not permanent. This tools is of great help to web/css designers. | |||
The style of any html element can be tweaked and checked in real-time. This tools is of great help to web/css designers. | |||
[[File: | [[File:edit_css_1.png ]][[File:edit_css_2.png ]] | ||
=== JavaScript Debugging === | === JavaScript Debugging === | ||
---- | |||
---- | ---- | ||
| Line 44: | Line 56: | ||
==== Console Panel ==== | ==== Console Panel ==== | ||
This panel primarily allows you to log information and shows errors and warnings in your code. | This panel primarily allows you to log information and shows errors and warnings in your code. | ||
First you need to enable logging of debug information which can be done by checking "Show JavaScript Errors" and "Show JavaScript Warnings" in the options menu.The options menu can be found by clicking on the little arrow in the panel tab or right clicking on the panel tab | First you need to enable logging of debug information which can be done by checking "Show JavaScript Errors" and "Show JavaScript Warnings" in the options menu.The options menu can be found by clicking on the little arrow in the panel tab or right clicking on the panel tab. This makes all the errors and warnings in the JavaScript code be displayed on the console tab. You can also enable "Show Stack Trace with Errors", a small icon will be shown besides the run-time errors which on expanding will show the stack trace. The console panel also allows to log user defined messages. | ||
[[File:Console_panel.png]] | [[File:Console_panel.png]] | ||
==== Script Panel ==== | ==== Script Panel ==== | ||
The script panel provides powerful functionality of step-debugging your code. In order to step debug your code, Firebug has various methods to stop the execution of code at specific point and continue watching or inspecting the outcome at each step. | The script panel provides powerful functionality of step-debugging your code. In order to step debug your code, Firebug has various methods to stop the execution of code at specific point and continue watching or inspecting the outcome at each step. Following are some ways in which you can stop the execution of script and use execution control buttons listed below to continue debugging your code. | ||
* '''Breakpoints''' | * '''Breakpoints''' | ||
| Line 55: | Line 67: | ||
* '''Using Debugger keyword''' | * '''Using Debugger keyword''' | ||
The keyword <code>debugger;</code> can be placed in the code at the point where you want to stop execution. | The keyword <code>debugger;</code> can be placed in the code at the point where you want to stop execution. | ||
if(var == 0){ | |||
debugger; | |||
} | |||
In the above example if value of var becomes equal to 0, the control would go to the next statement which is debugger. This statement would make the execution to halt at this line and a notification for the break point would be shown. | |||
* '''Break On''' | * '''Break On''' | ||
Firebug also a break on feature which stops the script execution when a specific event occurs. This feature is present in several panels. | Firebug also has a break on feature which stops the script execution when a specific event occurs. This feature is present in several panels. | ||
===== Script Panel Toolbar ===== | |||
Following is a brief description of the tools available in script panel toolbar. | |||
* '''Break On Features''' | |||
There is a break on Next button([[File:Break_On_Next_Button.png]]) which allows you to stop the script execution at the next executed command. When you click on the button and a script execution comes, the debugger halts the script and you can step through the script using the execution control buttons. | |||
* '''Menu for Script Types''' | |||
There are 3 different types of scripts. | |||
{| class="wikitable" style="vertical-align:top;" | |||
|- bgcolor=lightgrey | |||
! style="width:60px" | Type || Description | |||
|- | |||
|static || Scripts loaded together with the page (via the <script> tag) | |||
|- | |||
|event || Scripts generated through an event | |||
|- | |||
|eval() || Scripts executed using the eval() function (e.g. scripts loaded via an XMLHttpRequest) | |||
|} | |||
Firebug provides the option to show each of these types of scripts in the following combinations which makes debugging easier. | |||
[[File:script type-wiki.png]] | |||
* '''Execution Control Buttons''' | |||
The following buttons are available to step through the code once the control is provided to the developer at a break point. | |||
{| class="wikitable" style="vertical-align:top;" | |||
|- bgcolor=lightgrey | |||
! style="width:60px" | Type || style="width:50px" | Button || Description | |||
|- | |||
| Rerun || [[Image:rerunButton.png|center]] || Reruns the current call stack | |||
|- | |||
| Continue || [[Image:continueButton.png|center]] || To continue the script execution until the next breakpoint or the execution ends | |||
|- | |||
| Step Into || [[Image:stepIntoButton.png|center]]|| Get inside the body of the function to debug it. | |||
|- | |||
| Step over || [[Image:stepOverButton.png|center]] || Executes functions,moves to the next line of the same scope does not go inside the function. | |||
|- | |||
| Step out || [[Image:stepOutButton.png|center]] || Executes the rest of the current function and jumps back to it's caller | |||
|} | |||
The attached screenshot shows the script panel, the breakpoint at line 6074 stops execution of code at that line which is also highlighted in yellow. On the right side, the values of the variables like "state" can be seen at runtime under the Watch panel. | The attached screenshot shows the script panel, the breakpoint at line 6074 stops execution of code at that line which is also highlighted in yellow. On the right side, the values of the variables like "state" can be seen at runtime under the Watch panel. | ||
[[File:script-debug.png]] | [[File:script-debug.png]] | ||
==== Step Debugging ==== | ==== Step Debugging ==== | ||
Once the script execution is stopped at a particular step, detailed information about values of variables, stack trace and method parameters can be seen on the Watch and Stack side panel. You can continue the execution of your script slowly watching the behavior of your script using the Execution control buttons. Hovering on the variables and functions in script panel will also give you information about their values. | Once the script execution is stopped at a particular step, detailed information about values of variables, stack trace and method parameters can be seen on the Watch and Stack side panel. You can continue the execution of your script slowly watching the behavior of your script using the Execution control buttons. Hovering on the variables and functions in script panel will also give you information about their values. | ||
=== Debugging XmlHttpRequest === | |||
---- | |||
---- | |||
Firebug can also be used to debug XmlHttpRequest. To enable select "Show XmlHttpRequests" in the options menu. Once you enable this, whenever an XmlHttpRequest is made, the request made, response received, time taken, value of the headers for the request etc. can be seen on the console panel. Refer to [http://codeclimber.net.nz/archive/2007/08/01/How-to-debug-XmlHttpRequest-with-Firebug.aspx Debug XmlHttpRequest with Firebug] | |||
=== Network Performance Analysis === | === Network Performance Analysis === | ||
---- | |||
---- | ---- | ||
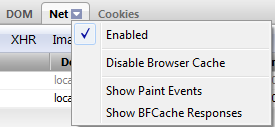
To view the net panel, | To view the net panel, right click on net tab menu and enable net panel as shown in the screenshot below. | ||
[[File:net_enable.png]] | [[File:net_enable.png]] | ||
This panel shows the network performance of each request and also the time taken | Another important consideration when designing a website is the page load time. This panel shows the network performance of each request and also the time taken for each response. By laying the load time out in a timeline various sources of delay can be tracked. The sources includes html, css, javascript, images etc. Options to see the analysis of these sources appear on the menu bar of net tab. | ||
[[File: | It also shows the start and finish time of loading a file relative to the other files. This helps in tuning the order of files to show up in the page, so that the users don't have to wait for the important information to be displayed. | ||
[[File:net_perf_2.png]] | |||
== Advantages and Disadvantages == | == Advantages and Disadvantages == | ||
=== Advantages === | === Advantages === | ||
* Inspecting and Editing HTML | * '''Inspecting and Editing HTML''' | ||
Firebug allows you to inspect HTML code as it currently appears not after JavaScript has modified it. It therefore gives you the flexibility to debug more efficiently and reduces the overall time to debug. If you edit the code the changes are reflected immediately and are highlighted in yellow in the firebug window. | Firebug allows you to inspect HTML code as it currently appears not after JavaScript has modified it. It therefore gives you the flexibility to debug more efficiently and reduces the overall time to debug. If you edit the code the changes are reflected immediately and are highlighted in yellow in the firebug window. | ||
* Ability to find errors quickly | * '''Ability to find errors quickly''' | ||
One of major advantage of Firebug is that it shows the errors in your code in the bottom left corner of the firebug window in bold red. You can examine all the errors pertaining to the webpage you are editing. The errors are organized so that it is easy to find and address it. | One of major advantage of Firebug is that it shows the errors in your code in the bottom left corner of the firebug window in bold red. You can examine all the errors pertaining to the webpage you are editing. The errors are organized so that it is easy to find and address it. | ||
* Editing CSS | * '''Editing CSS''' | ||
You can easily tweak CSS features using the cascading style sheet. When you click on a CSS feature, an editor pops up which allows you to edit the code and the changes are immediately reflected and are reversible. | You can easily tweak CSS features using the cascading style sheet. When you click on a CSS feature, an editor pops up which allows you to edit the code and the changes are immediately reflected and are reversible. | ||
* '''Monitoring Network Activity and Performance''' | |||
Another important consideration when designing a website is the page load time.As explained in the above section, Firebug has the Net panel which is a powerful tool to monitor network activity and performance. It allows you to monitor the activity of every single file on the website. You can also filter files by their type and organize them by amount of activity which can help in debugging. By laying the load time out in a timeline various sources of delay can be tracked. For example in the screenshot above the main document takes just short of half a second to load. | |||
=== Disadvantages === | === Disadvantages === | ||
| Line 94: | Line 169: | ||
* It is not available for Internet Explorer. | * It is not available for Internet Explorer. | ||
* May sometimes(though rarely) make Firefox unstable. | * May sometimes(though rarely) make Firefox unstable. | ||
== Other web development tools == | |||
Other web development tools available are : | |||
*[http://en.wikipedia.org/wiki/Internet_Explorer_Developer_Tools Internet Explorer Developer Tools] | |||
*[http://en.wikipedia.org/wiki/Opera_Dragonfly Opera Dragonfly] | |||
*[https://developer.apple.com/technologies/safari/developer-tools.html Safari's Web Inspector] | |||
*[https://developers.google.com/chrome-developer-tools/ Google Chrome Developer Tool] | |||
All these tools work like firefug with their own minor variances, which make various actions a tiny bit easier or harder. Since websites should be cross-browser compatible, one have to be really comfortable in the debugging tools of every browser. Firebug can be good starting point for a naive developer as it is very easy to use. | |||
== Conclusion == | |||
To summarize Firebug is the most popular and powerful web development tool. It provides features to modify style and layout in real time and uses the most advanced JavaScript debugger available for a large number of browsers. It also has a lot of support available on the web to learn and use its capabilities to develop advanced websites. It is highly recommended for web developers to use this tool, as it will certainly make web development much easier. | |||
== References == | == References == | ||
* http://getfirebug.com/ | |||
* http://getfirebug.com/wiki/index.php/Script_Debugging | * http://getfirebug.com/wiki/index.php/Script_Debugging | ||
* http://www.ehow.com/info_8544247_advantages-firebug.html | |||
* https://addons.mozilla.org/en-US/firefox/addon/firebug/ | |||
* http://getfirebug.com/wiki/index.php/Script_Panel | * http://getfirebug.com/wiki/index.php/Script_Panel | ||
* http://en.wikipedia.org/wiki/Firebug_(software) | |||
* http://www.ulancer.com/2012/01/firebug-tutorial-getting-started/ | |||
* http://codeclimber.net.nz/archive/2007/08/01/How-to-debug-XmlHttpRequest-with-Firebug.aspx | |||
* http://www.smashingmagazine.com/2008/11/18/15-helpful-in-browser-web-development-tools/ | |||
== See More == | |||
For better understanding [http://www.youtube.com/watch?v=sHbYpl1XFiM see this video] | |||
Latest revision as of 03:58, 25 September 2013
Debugging Using Firebug

Firebug is a Firefox browser add-on that puts together various web development tools to facilitate web development. It enables web developers to debug, edit and inspect websites' components like CSS, HTML, DOM, JavaScripts. Firebug is free and open source software distributed under the BSD License. Apart from providing debugging, Firebug is also used to analyse performance of websites. It is widely used in major companies such as Amazon, eBay, ThoughtWorks etc. by web developers to test and fix bugs in their code.
Installation and Activation
Firebug can be installed as a Add-On/Plugin for Firefox. Firebug compatibility for different versions of Firefox can be looked here. A cross-browser version is in development.
Following are the ways to activate Firebug
- Click F12 => Activates Firebug on same window as a bar at the bottom.
- Click Ctrl+F12 => Activates Firebug on a separate window
- Right click on the webpage and click on "Inspect Element with Firebug".
Debugging
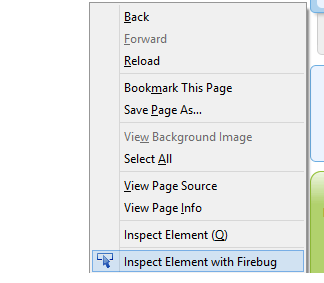
Firebug provides different tabs to examine HTML(Markup), CSS(Styling), DOM(Document Object Model), Scripts, Net (Network Analysis) etc. This section briefly explains the various tools available by Firebug and how to use them to debug web applications. To start with debugging, you should right click on the browser and select "Inspect element with Firebug", which will show the Firebug panel.
HTML Debugging
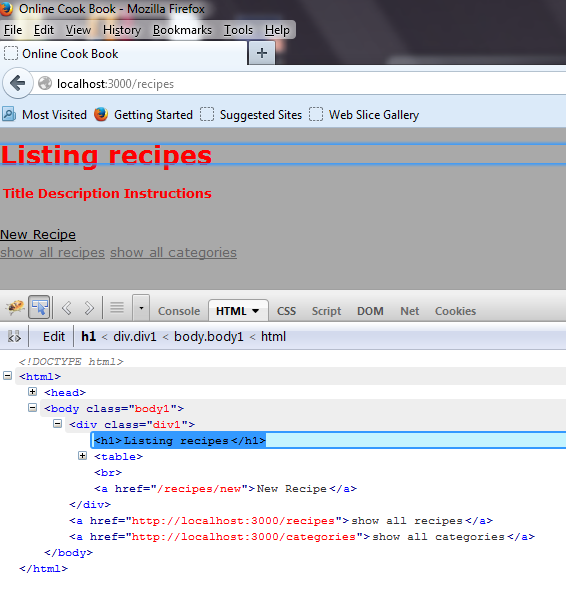
Firebug can point any HTML element with precision. HTML elements' attributes and text can be created, deleted, or edited just by clicking them. The changes will be reflected immediately as one type. The below snapshot depicts the position of selected "h1" element in html.
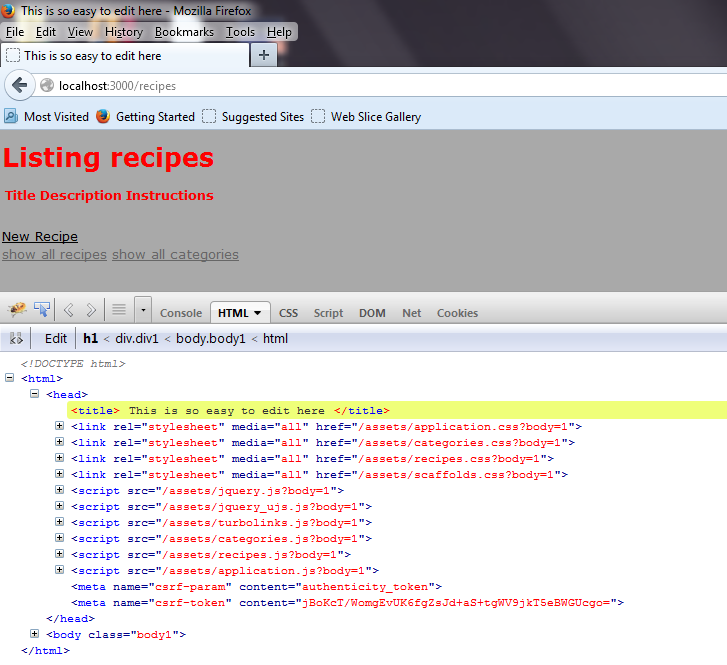
Once an element is selected, you can change its value to see its affect on the page. These edits are not permanent. It just provide a kind of visual aid to web designer in enriching the look and feel of the page. The below snapshot depicts the editing of title. This change is applied immediately as you type.
CSS Debugging
Firebug shows the styles that cascade together for each element. Style rules are viewed in the order of precedence. The overridden properties are struck out. Eg if body have style {text-color : red;}. Every element in body follow this style(known as cascading of styles). But if an element (element1) have its own style like .element1 {text-color :blue;} then the body style is struck out and the text in element1 are in blue color. Thus inspecting styles of any element is very easy with firebug.
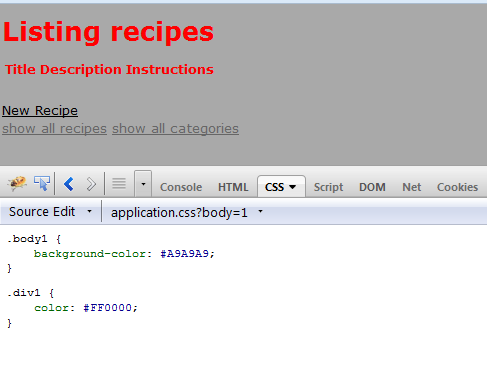
The style of any html element can be tweaked and checked in real-time. In the below snapshot, background-color of .body1 is changed to blue. This change is applied immediately. But, as mentioned earlier, these tweaks are not permanent. This tools is of great help to web/css designers.
JavaScript Debugging
Firebug can be used to debug JavaScript code using the Console and Script Panel provided by this tool. These panels allow you to step-debug your code, profile performance, log errors and information and other useful functionality.
Console Panel
This panel primarily allows you to log information and shows errors and warnings in your code. First you need to enable logging of debug information which can be done by checking "Show JavaScript Errors" and "Show JavaScript Warnings" in the options menu.The options menu can be found by clicking on the little arrow in the panel tab or right clicking on the panel tab. This makes all the errors and warnings in the JavaScript code be displayed on the console tab. You can also enable "Show Stack Trace with Errors", a small icon will be shown besides the run-time errors which on expanding will show the stack trace. The console panel also allows to log user defined messages.
Script Panel
The script panel provides powerful functionality of step-debugging your code. In order to step debug your code, Firebug has various methods to stop the execution of code at specific point and continue watching or inspecting the outcome at each step. Following are some ways in which you can stop the execution of script and use execution control buttons listed below to continue debugging your code.
- Breakpoints
You can set breakpoint on the line you want to stop execution by clicking on the breakpoint column on the left side inside the Script Panel. In some of the breakpoints, firebug allows you to set a condition to control when they trigger. There is a breakpoint side Panel to manage breakpoints.
- Using Debugger keyword
The keyword debugger; can be placed in the code at the point where you want to stop execution.
 if(var == 0){
     debugger;
 }
In the above example if value of var becomes equal to 0, the control would go to the next statement which is debugger. This statement would make the execution to halt at this line and a notification for the break point would be shown.
- Break On
Firebug also has a break on feature which stops the script execution when a specific event occurs. This feature is present in several panels.
Script Panel Toolbar
Following is a brief description of the tools available in script panel toolbar.
- Break On Features
There is a break on Next button(![]() ) which allows you to stop the script execution at the next executed command. When you click on the button and a script execution comes, the debugger halts the script and you can step through the script using the execution control buttons.
) which allows you to stop the script execution at the next executed command. When you click on the button and a script execution comes, the debugger halts the script and you can step through the script using the execution control buttons.
- Menu for Script Types
There are 3 different types of scripts.
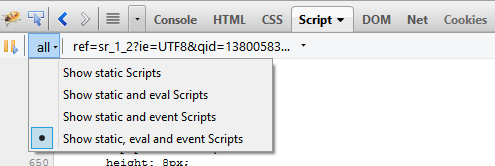
| Type | Description |
|---|---|
| static | Scripts loaded together with the page (via the <script> tag) |
| event | Scripts generated through an event |
| eval() | Scripts executed using the eval() function (e.g. scripts loaded via an XMLHttpRequest) |
Firebug provides the option to show each of these types of scripts in the following combinations which makes debugging easier.
- Execution Control Buttons
The following buttons are available to step through the code once the control is provided to the developer at a break point.
The attached screenshot shows the script panel, the breakpoint at line 6074 stops execution of code at that line which is also highlighted in yellow. On the right side, the values of the variables like "state" can be seen at runtime under the Watch panel.
Step Debugging
Once the script execution is stopped at a particular step, detailed information about values of variables, stack trace and method parameters can be seen on the Watch and Stack side panel. You can continue the execution of your script slowly watching the behavior of your script using the Execution control buttons. Hovering on the variables and functions in script panel will also give you information about their values.
Debugging XmlHttpRequest
Firebug can also be used to debug XmlHttpRequest. To enable select "Show XmlHttpRequests" in the options menu. Once you enable this, whenever an XmlHttpRequest is made, the request made, response received, time taken, value of the headers for the request etc. can be seen on the console panel. Refer to Debug XmlHttpRequest with Firebug
Network Performance Analysis
To view the net panel, right click on net tab menu and enable net panel as shown in the screenshot below.
Another important consideration when designing a website is the page load time. This panel shows the network performance of each request and also the time taken for each response. By laying the load time out in a timeline various sources of delay can be tracked. The sources includes html, css, javascript, images etc. Options to see the analysis of these sources appear on the menu bar of net tab.
It also shows the start and finish time of loading a file relative to the other files. This helps in tuning the order of files to show up in the page, so that the users don't have to wait for the important information to be displayed.
Advantages and Disadvantages
Advantages
- Inspecting and Editing HTML
Firebug allows you to inspect HTML code as it currently appears not after JavaScript has modified it. It therefore gives you the flexibility to debug more efficiently and reduces the overall time to debug. If you edit the code the changes are reflected immediately and are highlighted in yellow in the firebug window.
- Ability to find errors quickly
One of major advantage of Firebug is that it shows the errors in your code in the bottom left corner of the firebug window in bold red. You can examine all the errors pertaining to the webpage you are editing. The errors are organized so that it is easy to find and address it.
- Editing CSS
You can easily tweak CSS features using the cascading style sheet. When you click on a CSS feature, an editor pops up which allows you to edit the code and the changes are immediately reflected and are reversible.
- Monitoring Network Activity and Performance
Another important consideration when designing a website is the page load time.As explained in the above section, Firebug has the Net panel which is a powerful tool to monitor network activity and performance. It allows you to monitor the activity of every single file on the website. You can also filter files by their type and organize them by amount of activity which can help in debugging. By laying the load time out in a timeline various sources of delay can be tracked. For example in the screenshot above the main document takes just short of half a second to load.
Disadvantages
- May cause Firefox slightly slower since firebug is relatively big.
- It is not available for Internet Explorer.
- May sometimes(though rarely) make Firefox unstable.
Other web development tools
Other web development tools available are :
- Internet Explorer Developer Tools
- Opera Dragonfly
- Safari's Web Inspector
- Google Chrome Developer Tool
All these tools work like firefug with their own minor variances, which make various actions a tiny bit easier or harder. Since websites should be cross-browser compatible, one have to be really comfortable in the debugging tools of every browser. Firebug can be good starting point for a naive developer as it is very easy to use.
Conclusion
To summarize Firebug is the most popular and powerful web development tool. It provides features to modify style and layout in real time and uses the most advanced JavaScript debugger available for a large number of browsers. It also has a lot of support available on the web to learn and use its capabilities to develop advanced websites. It is highly recommended for web developers to use this tool, as it will certainly make web development much easier.
References
- http://getfirebug.com/
- http://getfirebug.com/wiki/index.php/Script_Debugging
- http://www.ehow.com/info_8544247_advantages-firebug.html
- https://addons.mozilla.org/en-US/firefox/addon/firebug/
- http://getfirebug.com/wiki/index.php/Script_Panel
- http://en.wikipedia.org/wiki/Firebug_(software)
- http://www.ulancer.com/2012/01/firebug-tutorial-getting-started/
- http://codeclimber.net.nz/archive/2007/08/01/How-to-debug-XmlHttpRequest-with-Firebug.aspx
- http://www.smashingmagazine.com/2008/11/18/15-helpful-in-browser-web-development-tools/
See More
For better understanding see this video
