File:Analysis Diagram.jpg: Difference between revisions
Jump to navigation
Jump to search
(The flow diagram shows the relationship between coding, testing, and static code analysis. It starts with coding, which leads to testing. Testing is accomplished using the Red/Green method. Once all tests have completed successfully, static code analys) |
(No difference)
|
Latest revision as of 05:22, 25 October 2010
The flow diagram shows the relationship between coding, testing, and static code analysis. It starts with coding, which leads to testing. Testing is accomplished using the Red/Green method. Once all tests have completed successfully, static code analysis is used to catch anything that has fallen between the cracks of testing. Finally, the code is cleaned up and perfected, which causes the need for testing again.
File history
Click on a date/time to view the file as it appeared at that time.
| Date/Time | Thumbnail | Dimensions | User | Comment | |
|---|---|---|---|---|---|
| current | 05:22, 25 October 2010 | 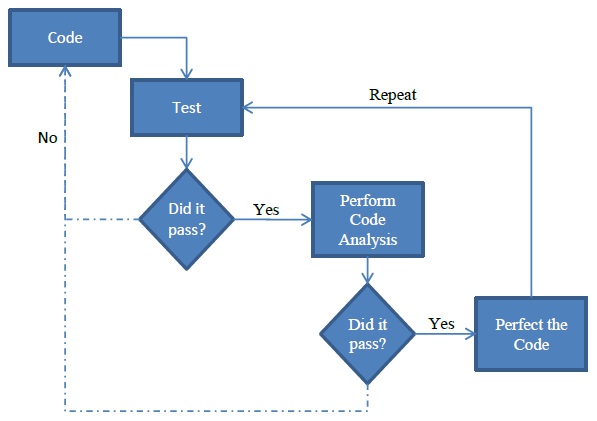 | 597 × 421 (37 KB) | Mjgraber (talk | contribs) | The flow diagram shows the relationship between coding, testing, and static code analysis. It starts with coding, which leads to testing. Testing is accomplished using the Red/Green method. Once all tests have completed successfully, static code analys |
You cannot overwrite this file.
File usage
The following 2 pages use this file: