Independent Study Spring 2019/Logging
Abstract
This independent study, Support for logging & data-mining peer-assessment behavior in Spring 2019, is about logging, which is convenient for the administrator or instructor to gather valuable usage of Expertiza from students and do some studies. This study can be divided into 2 parts, refactor of views/versions page and setup of The Elastic Stack.
views/versions
The previous version of views/versions page doesn't work well, so we need some refactoring to make it better.
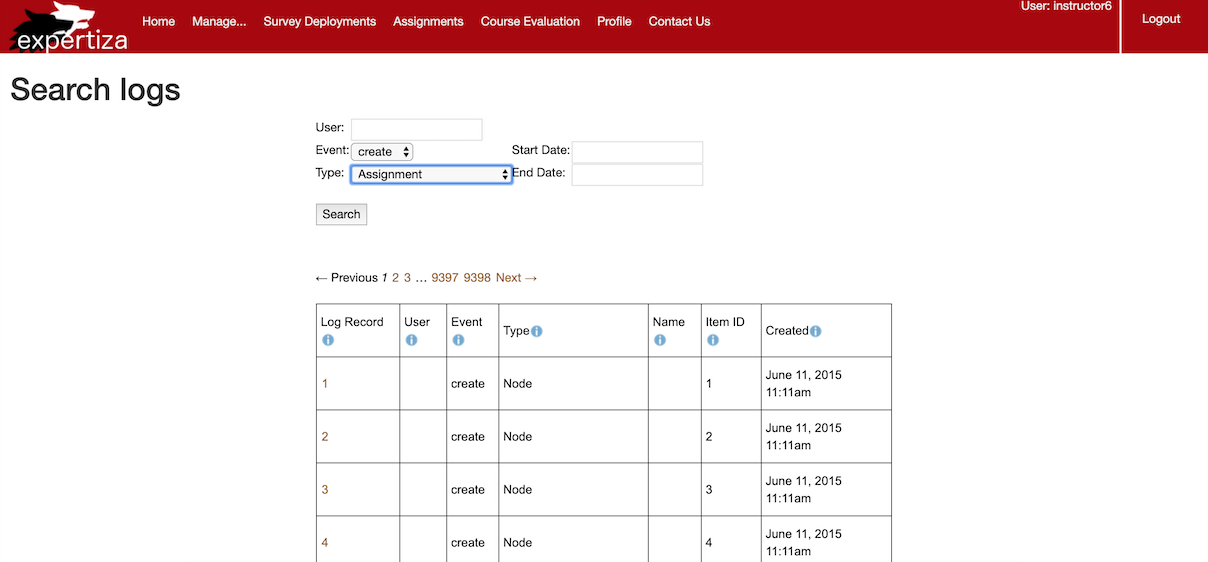
- Before

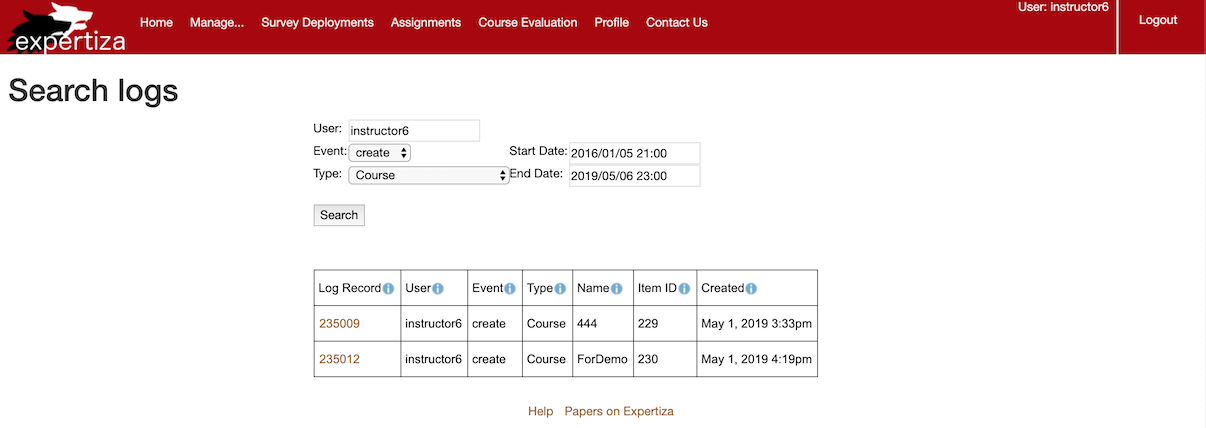
- After

- Search for "instructor6" "create" "course" between "2016/01/05 21:00" and "2019/05/06 23:00".

- Search for "instructor6" "create" "assignment" between "2016/01/05 21:00" and "2019/05/06 23:00".

- Search for "instructor6" "update" "course" between "2016/01/05 21:00" and "2019/05/06 23:00".

- Search for "instructor6" "update" "assignment" between "2016/01/05 21:00" and "2019/05/06 23:00".

What needs to be done?
- Current UI needs to record the username.
- All fields of event records need to have info buttons describing what they do.
- Search form needs to be changed.
- More models need to be tracked by PaperTrail.
- The order of log attributes needs to be changed.
- We need to add a column for the title (assignment name, course name, rubric name, etc.)
- User ID should be the username of the user, not the user’s row number in the users table.
- Figure out a way to show data in local timezone, because the time stored in database is in UTC by default.
Files Modified
- application_controller.rb
- versions_controller.rb
- versions/_pagination.html.erb
- versions/search.html.erb
- versions/show.html.erb
New gem, local_time
The Elastic Stack
Setup Steps
These steps are based on macOS, if you are using other OS, there are more information on Guide.
Download
First, we need to download Elasticsearch, Kibana, Logstash, and Filebeat, then, unzip them.
- Elasticsearch centrally stores your data so you can discover the expected and uncover the unexpected.
- Kibana lets you visualize your Elasticsearch data and navigate the Elastic Stack.
- Logstash ingests data from a multitude of sources simultaneously, transforms it, and then sends it to your favorite “stash.”
- Filebeat is one of Beats which send data from hundreds or thousands of machines and systems to Logstash or Elasticsearch.
Edit Configuration
- Filebeat(filebeat.yml)
1. Enable Filebeat inputs. 2. Change paths to your own.
   #=========================== Filebeat inputs =============================
   filebeat.inputs:
   # Each - is an input. Most options can be set at the input level, so
   # you can use different inputs for various configurations.
   # Below are the input specific configurations.
   - type: log
     # Change to true to enable this input configuration.
     enabled: true
     # Paths that should be crawled and fetched. Glob based paths.
     paths:
       - /Users/kezhao/Desktop/expertiza/log/expertiza_info.log
       #- c:\programdata\elasticsearch\logs\*
3. Disable Elasticsearch output.
   #-------------------------- Elasticsearch output ------------------------------
   #output.elasticsearch:
     # Array of hosts to connect to.
     #hosts: ["localhost:9200"]
4. Enable Logstash output.
   #----------------------------- Logstash output --------------------------------
   output.logstash:
     # The Logstash hosts
     hosts: ["localhost:5044"]
- Logstash(Create a new file expertiza.conf)
   input {
     beats {
       port => "5044"
     }
   }
   # The filter part of this file is commented out to indicate that it is
   # optional.
   filter {
      grok {
      	match => { "message" => "TST=\[%{DATA:timestamp}\] SVT=\[%{DATA:sev}\] PNM=\[%{DATA:pgnm}\] OIP=\[%{DATA:originip}\] RID=\[%{DATA:requestid}\] CTR=\[%{DATA:generatedby}\] UID=\[%{DATA:unityid}\] MSG=\[%{GREEDYDATA:message}\]" }
      	overwrite => [ "message", "timestamp" ]
    	}
    	date {
      	match => ["timestamp", "ISO8601"]
    	}
   }
   output {
       elasticsearch {
           hosts => [ "localhost:9200" ]
       }
   }
Run!
Go into each folder and run the followings in the command-line interface in this order. Elasticsearch
- bin/elasticsearch
Kibana
- bin/kibana
Logstash
- bin/logstash -f expertiza.conf --config.reload.automatic
Filebeat
- sudo ./filebeat -e -c filebeat.yml -d "publish"
- If you encounter this error, Exiting: error loading config file: config file ("filebeat.yml") must be owned by the user identifier (uid=0) or root, try following
- sudo ./filebeat -e -c filebeat.yml -d "publish" --strict.perms=false
Configuration in Kibana
- Open http://localhost:5601
- Click "Discover" on the left side bar
- Enter "logstash*" in Index Pattern, or whatever you want as long as it can match with the index you create
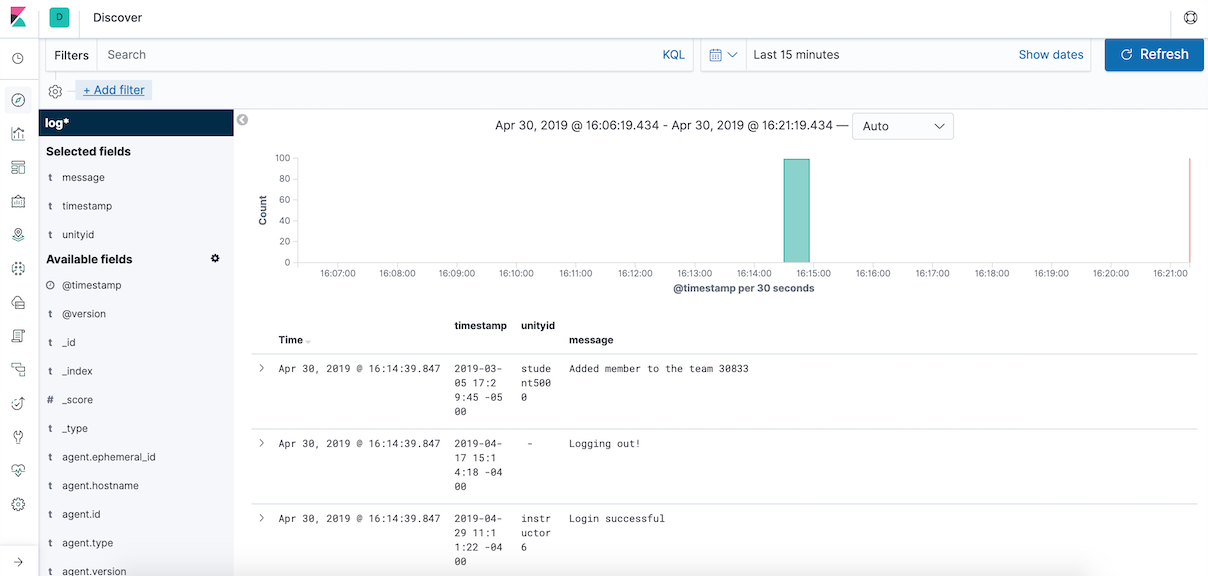
- After create the Index Pattern, click "Discover" again, add some Available fields left side, such as timestamp, unityid, and message.
- Then, you can add some filters to see a specific event, like log in&out, add team member and so on.

Future Study
In the future, we can gain more useful data from ExpertizaLogger, such as which OS or browser students are using and where students are visiting Expertiza, then we can study these data for educational purpose.