Independent Study Spring 2019/Errbit
Set up an open-source error monitoring tool instead of Airbrake
Useful links
Purpose
Errbit has been set-up, replacing the already existing Airbrake API to serve several purposes like :
- Errbit is a much more powerful monitoring tool
- Errbit is Airbrake API compliant
- Store unresolved errors indefinitely without any extra cost.
The Steps taken for the setup
There were several steps taken to set-up Errbit for Expertiza and schedule it to automatically pull changed from its forked branch and deploy:
Setup Heroku
- Made an account with Email: expertiza-support@lists.ncsu.edu and Password: expertiza2019@
Setup Errbit
- Fork Errbit from https://github.com/errbit/errbit and follow the steps mentioned on README.md
- When we run rake errbit:bootsrap or rake db:seed it will create an admin user with a random password. We can see these login credential in the console log. But instead, we can provide this username and password explicitly by just making some changes in errbit/db/seed.rb file.
Deploy Errbit on Heroku
- Created a new empty application on Heroku, namely errbit-expertiza2019
- The app will have an associated empty git repository https://git.heroku.com/errbit-expertiza2019.git
- Login to Heroku using Herkou CLI
Configure Expertiza to send errors to the deployed Errbit
- Create a new app on Errbit
- Copy it's configuration and place it in Expertiza
Set up Cron job to regularly pull changes from Forked repository and deploy on Heroku.
Log files
For different log levels, log messages are written in different files named expertiza_<log_level>.log
Currently, expertiza provides the capability of writing logs into 5 different custom log files.
For eg,
- expertiza_info.log
- expertiza_warn.log
- expertiza_error.log
- expertiza_fatal.log
- expertiza_debug.log
Apart from above files, <environment>.log file is used for logging messages which could not be logged by ExpertizaLogger, like, page load messages or certain load time exceptions.
Since Rails logger provides writing into a specific log file, to restrict least file switch, ExpertizaLogger holds different log level loggers in separate instance variables. A new logger instance is created and assigned whenever Rails removes the link to manage memory consumption.
Components
ExpertizaLogger
This class provides the logger needed for logging messages for different log levels. It provides 5 different static methods namely info, warn, error, fatal and debug which could be called as follows:
ExpertizaLogger.info message
where message could be an instance of LoggerMessage or a string.
Custom LoggerMessage
A LoggerMessage instance could be created as follows:
LoggerMessage.new(<controller_name>, <user_id>, <message>, <request object>)
Fourth parameter i.e <request object> is an optional parameter.
Whenever a request is made, the request object is injected into the controller and is available in the controller as "request". Similarly, <controller_name> is available in "controller_name" inside controller. For other trigger points, file name could be passed as a string.
Since the request object holds the <origin_ip> and <request_id>, it is used to capture and log both into the log message.
ExpertizaLogFormatter
It captures the message and determines if the message is an instance of LoggerMessage or not. Based on that, it creates a message by populating message placeholders as below:
   if msg.is_a?(LoggerMessage)
     "TST=[#{ts}] SVT=[#{s}] PNM=[#{pg}] OIP=[#{msg.oip}] RID=[#{msg.req_id}] CTR=[#{msg.generator}] UID=[#{msg.unity_id}] MSG=[#{filter(msg.message)}]\n"
   else
     "TST=[#{ts}] SVT=[#{s}] PNM=[#{pg}] OIP=[] RID=[] CTR=[] UID=[] MSG=[#{filter(msg)}]\n"
   end
All the exceptions are preprocessed to remove newline characters so that it could fit in a single line as a message.
All the messages that are not logged by ExpertizaLogger, there is a separate logger definition provided in config/environments/<environment>.rb as:
 config.log_formatter = proc do |s, ts, pg, msg|
   if msg.is_a?(LoggerMessage)
     "TST=[#{ts}] SVT=[#{s}] PNM=[#{pg}] OIP=[#{msg.oip}] RID=[#{msg.req_id}] CTR=[#{msg.generator}] UID=[#{msg.unity_id}] MSG=[#{filter(msg.message)}]\n"
   else
     "TST=[#{ts}] SVT=[#{s}] PNM=[#{pg}] OIP=[] RID=[] CTR=[] UID=[] MSG=[#{filter(msg)}]\n"
   end
 end
Environment config
config.log_tags = [ :remote_ip, :uuid ]
These config.log_tags entries make sure that <origin_ip> and <request_id> are prepended to messages. These are for messages which are not logged by ExpertizaLogger but by the Rails default logger. These messages go in <environment>.log file.
Restrictions
The request object is not available beyond the controllers. Hence, <origin_ip> and <request_id> remains uncaptured if messages are logged from somewhere other than controllers.
Visualization through ELK stack
Configuration
Filebeat (filebeat.yml)
Changes:
- type: log
 # Change to true to enable this prospector configuration.
 enabled: true
 # Paths that should be crawled and fetched. Glob based paths.
 paths:
   - <path to log files>*.log
output.logstash:
 # The Logstash hosts
 hosts: ["<ip>:<5044:port of logstash>"]
Filebeat sends all log files to logstash.
Logstash (expertiza-logstash.conf)
  input {
       beats {
           port => "5044"
       }
  }
  filter {
   grok {
   	match => { "message" => "TST=\[%{DATA:timestamp}\] SVT=\[%{DATA:sev}\] PNM=\[%{DATA:pgnm}\] OIP=\[%{DATA:originip}\] RID=\[%{DATA:requestid}\] CTR=\[%{DATA:generatedby}\] UID=\[%
  {DATA:unityid}\] MSG=\[%{GREEDYDATA:message}\]" }
   	overwrite => [ "message", "timestamp" ]
 	}
 	date {
   	match => ["timestamp", "ISO8601"]
 	}

   }
   output {
     elasticsearch {
       hosts => [ "localhost:9200" ]
     }
   }
Logstash reads each line from the log file and parses it based on the template provided in grok match above. It then sends each message entry into Elastic search.
Kibana (config/kibana.yml)
elasticsearch.url: "http://localhost:9200"
Kibana picks each entry from Elastic search and provides into the web interface.
Setup
ELK stack could be set up to visualize and analyze the messages from the log files.
Once ELK is installed, below commands could be used to run each server:
Clear Elastic search cache
curl -X DELETE 'http://localhost:9200/_all'
Filebeat
sudo rm data/registry
sudo ./filebeat -e -c filebeat.yml -d "publish"
Logstash
bin/logstash -f expertiza-logstash.conf --config.reload.automatic
Kibana
bin/kibana
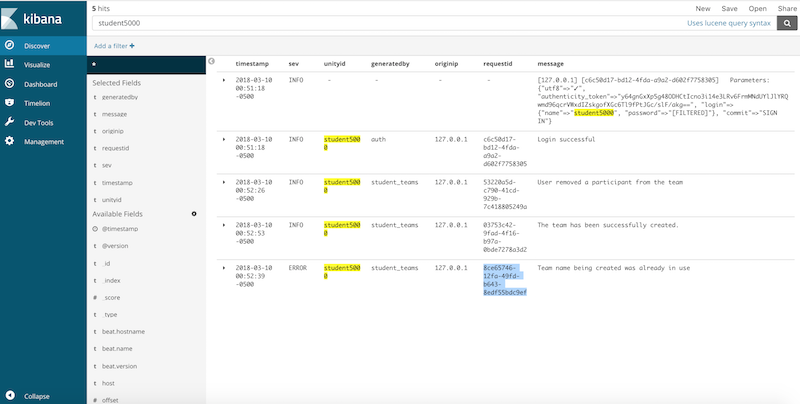
Kibana Interface
Success message in Kibana
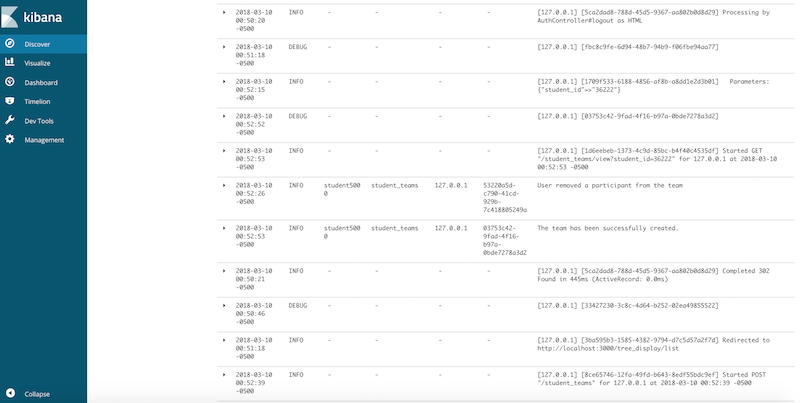
Exception in kibana
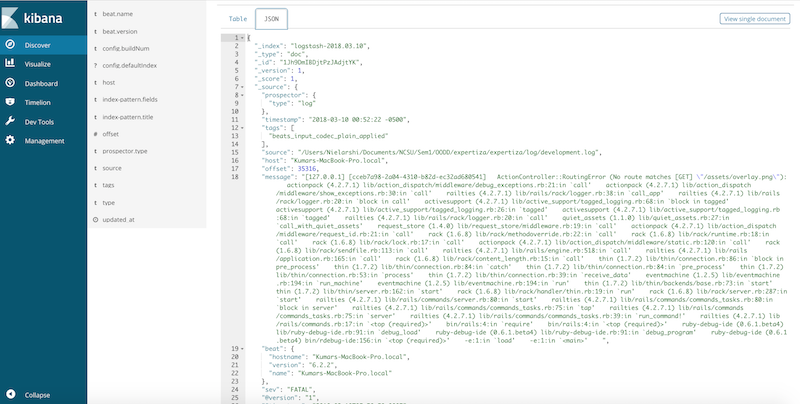
Tracing error in kibana
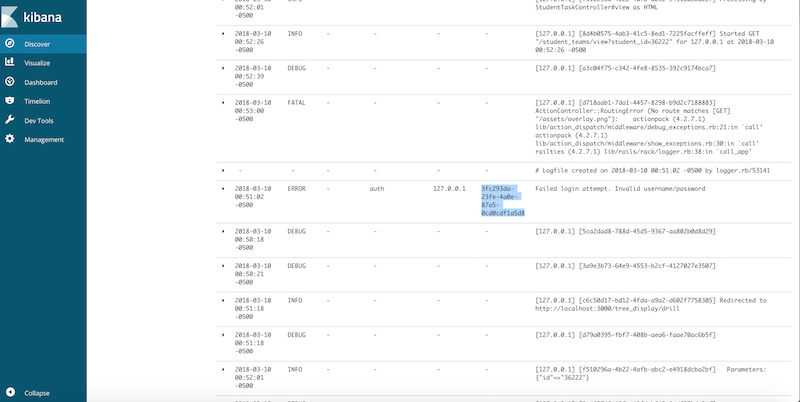
Search records using request ID in kibana
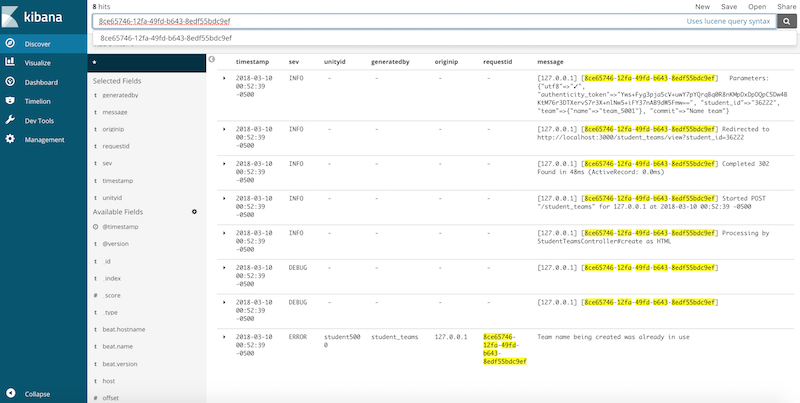
Searching records using unity id in kibana
