E1858 Github metrics integration
Introduction
Problem Statement
Expertiza provides view submission and teammate review (under view score) functionality for each assignment. Purpose of this project is to augment existing assignment submissions with data that can give more realistic view on work contribution of every team member using external tools like Github. This external data may include: number of commits, number of lines of code modified, number of lines added, number of lines deleted from each group’s submitted repository link from Github.
- 1. View submission provides list of submission of all the teams for that particular assignment. We can add new column to show work distribution among the whole team from external tools like Github. This new column will provide work distribution on whole team using bar graphs and other statistics.
- 2. Teammate Reviews functionality gauges team mates views on how much each team member contributed, but we would like to augment this data with data from external tools like Github. New metrics will be appended under each student data.
for example, This information should prove useful for differentiating the performance of team members for grading purposes. Overall data for the team, like number of committers and number of commits may also help instructors to predict which projects are likely to be merged.
Overall Description
Current Scenario
At present, group assignments are submitted as a single submission that shows work done as a whole team. This does not show work contribution done by each teammate.
Assignment_sub_ss_1.png
Also teammate review shows views of each teammate on every other teammates work. That might leads to discrepancy while validating the reviews.
Teammatereview_ss_1.png
Checking commits performed by each team member on Github is one of the solution, but that does not seems efficient from instructor/reviews perspective considering huge number of assignments, number of submissions and tight deadlines.
Design Considerations
- The first thing is to determine what metrics we are looking for exactly. These are what the requirements document suggests:
- Total number of commits.
- Number of files changed.
- Lines of Code added
- Lines of code modified.
- Lines of code deleted.
- LOCs that survived until final submission - (exclude from MVP due to complexity and lower priority).
We are assuming these metrics are needed on a per-user basis.
The requirement document expects a view to be created for viewing the metrics under a new tab “Github Metrics” under “View Submissions” in the instructor view. A line chart of number of lines vs time needs to be included in the view.
- The next thing is to narrow down what hosting service for version control we will use. For now, the plan is to only support Github integration due to it popularity, ease-of-use and API documentation. Future projects could add in support for Gitlab and others, though it is far easier to just require that all students use Github.
- The main impact of this change will be that all submission repositories need to be made public as we need access to pull in the data.
- We also need to consider whether to ask students for github repo link separately(changes to views) or to parse all the uploaded links and determine the correct one (extra logic, students uploading multiple links or not giving links at all).
- An important question is whether we need to store metric information in our own db at all.
- An older investigation came up with this schema, but this is likely to cause issues with stale information and will be difficult to maintain.
- Having a db is redundant as every time a user wants to see the metrics, we would need to sync the db with Github and then show the results. So we end up hitting Github api anyway.
- An alternative to the above approach is to take snapshots of metrics and store them in the db right on the submission deadline of projects. This will allow for fairer grading by making sure we pull in data at the correct moment. Unfortunately, doing this for so many projects could put a lot of load on server. Also, for open source projects this would mean that we don’t have the latest data to work with(people will keep committing past deadline). Thus, this approach might be good for grading purposes but doesn’t help with determining the current status of a project.
- All that said, we might need to maintain some meta-data in our db- investigation pending.
- We also need to consider if we need to account for different branches. The initial plan is to only consider the master branch.
- A suggestion was also to make sure that there isn’t a lot of padding in the tables we show.
- The instructors need to spell out exact guidelines for committing to the projects repos(like everyone should commit their own code, keep the master as PR branch, commit regularly, be mindful of squashing too many commits for one user), so that we can have proper and correct data and, also so that students can’t weasel their way out later claiming they worked but forgot or didn’t know.
Application Flow
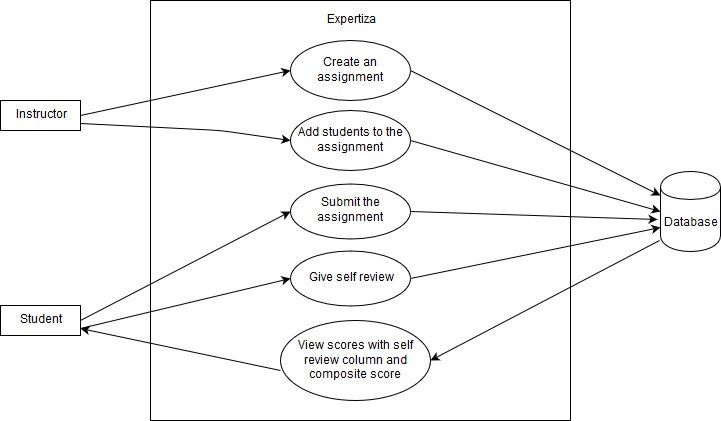
Use case Diagram
Actors:
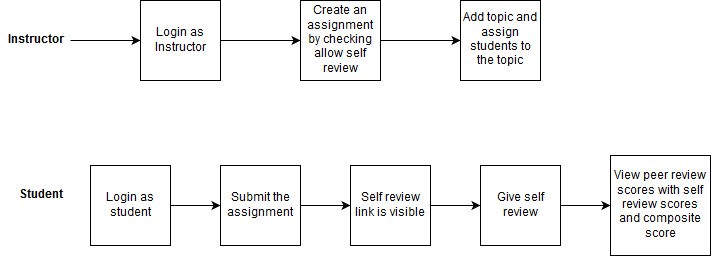
- Instructor: This actor is responsible for creating assignments and adding students to the assignment.
- Student: This actor is responsible for submitting, self-reviewing and viewing the scores.
Database:
- The database where all the data of Expertiza is getting stored.
All the other use cases are implemented except “View Scores with self-review column and composite score”
Use Case: View score with self-review column and composite score
Pre Conditions:
1.The Student should submit the assignment and self-review.
2.The other students should submit the reviews of the work submitted.
Primary Sequence:
1.The student should login.
2.The student should browse and upload the assignment.
3.The student should submit the assignment.
4.The student should submit the self-review.
5.The student should choose your scores to view the score.
6.The student should be able to see the peer-review score with the self-review scores and composite score.
Post Conditions:
1.The self-review and composite score will be visible on the page.
Database Design
1.The self-review data is getting stored in the database. This data is fetched from the database and shown in the view with the other peer-review columns.
2.The peer-review data and self-review data is fetched from the database and passed to the method. The method computes the composite score and is shown in the view.
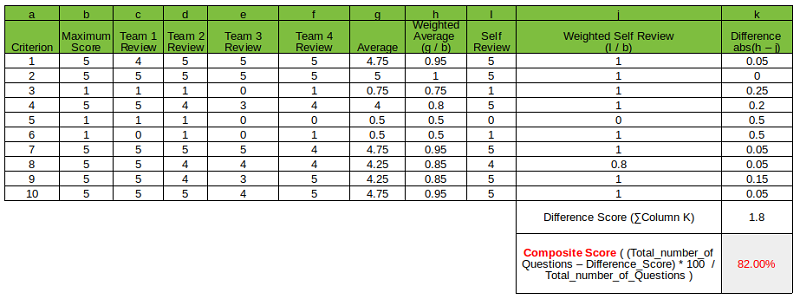
Method to calculate the composite score
The above data is taken from the actual reviews done for the third OSS project.
1.The average has been calculated for the reviews done by the other teams.
2.The weighted average is calculated by dividing average by maximum score.
3.The weighted self-review is calculated by dividing self-review score by maximum score.
4.Difference value is calculated by subtracting weighted average and weighted self review.
5.The sum of differences of all the criteria is calculated which gives the deviation from the total of review scores(Difference score).
6.The difference between the number of questions and the Difference score gives us the composite score. And divide the composite score by the number of questions and multiply by 100 to get the final composite score.
| Range | Self Review Quality |
| <30 | Improper assessment |
| 30 to 60 | Moderate |
| 60 to 80 | Can do better |
| 80 to 100 | Perfect |
Design Pattern
1.MVC – The project is implemented in Ruby on Rails that uses MVC architecture. It separates an application’s data model, user interface, and control logic into three distinct components (model, view and controller, respectively).
2.Dry Principle – We are trying to reuse the existing functionalities in Expertiza,thus avoiding code duplication. Whenever possible, code modification based on the existing classes, controllers, or tables will be done instead of creating the new one.
Plan of action
- The first thing is to investigate if there are any rails gems(Octokit/Unicorn maybe?) to get Github data and if we are allowed to use them. The idea is to always get the latest data from Github and show it to the user. For grading purposes, we could alternate a view between latest data and data till submission deadlines.
- If there are no such gems or if we aren’t allowed to use gems, we need to write to mock endpoints to understand out how to get data from github. There is ample documentation for this. The github api returns JSON which can be easily parsed.
- We then need to figure out how to load this data(AJAX? or gem?) when instructor selects “Github Rubrics” in the View Submissions page.
- We will need a mock up view to display this data in a table.
- We then implement the view. For charting, suggestion is to use a previous project for charting- 1 2 3.
Code Modifications
In app/views/grades/view_team.html.erb, we will add the html code to display one more column with the peer review columns. And the code will be added to display the composite score.
In app/models/vm_question_response.rb, we will add the method to calculate the composite score.
In app/models/response_map.rb, we will be including the self review logic in the condition statement mainly checking for the type of response map.
In app/models/vm_question_response_row.rb, we will be including the method to calculate the weighted average, which is used to calculate the overall composite score.
Implementation
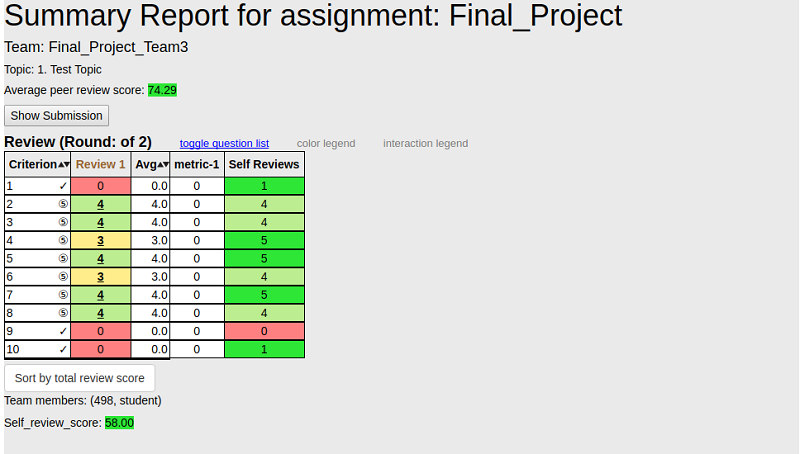
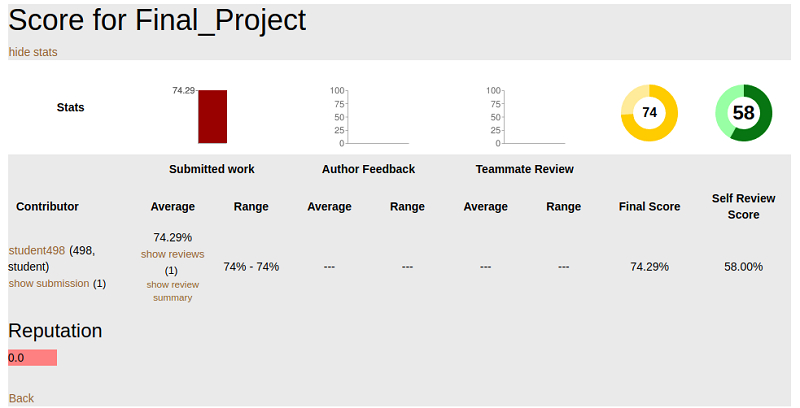
The last column has the self review scores. The composite score is calculated and is displayed at the bottom of the table.
The composite score is displayed beside the average peer review score.
Test Cases
| Test case ID | Test Objective | PreConditions | Steps | Test Data | Expected Result | Post Conditions |
| E1799_Test_Case_1 | Successfully displaying self review scores in the heat map view | 1. The student should do the self review.
2. The scores of the self review should be present in the database. |
1. Login to the Expertiza Application.
2. Submit the assignment created by the instructor by browsing it. 3. Choose the self review option and complete the self review. 4. Go to view scores option. |
Submit the relevant assignment before doing the self review. | The self review column is displayed together with the other peer reviews in the end. | The student is able to see the self review column. |
| E1799_Test_Case_2 | Successfully calculating the proper composite score. | 1. The student should do the self review.
2. The score of the self review should be present in the database. 3. The function is implemented to calculate the composite score using average of the peer reviews and the self review. |
1. Login to the Expertiza Application.
2. Submit the assignment created by the instructor by browsing it. 3. Choose the self review option and complete the self review. 4. Go to view scores option. |
Submit the relevant assignment before doing the self review. | The composite score is returned by the method. | The method is able to return the expected composite score. |
| E1799_Test_Case_3 | Successfully displaying of composite score in the heat map view. | 1. The student should do the self review.
2. The scores of the self review should be present in the database. |
1. Login to the Expertiza Application.
2. Submit the assignment created by the instructor by browsing it. 3. Choose the self review option and complete the self review. 4. Go to view scores option. |
Submit the relevant assignment before doing the self review. | The composite score is displayed in the heat map view. | The student is able to see the composite score. |
| E1799_Test_Case_4 | Successfully displaying of composite score in alternate view. | 1. The student should do the self review.
2. The scores of the self review should be present in the database. |
1. Login to the Expertiza Application.
2. Submit the assignment created by the instructor by browsing it. 3. Choose the self review option and complete the self review. 4. Go to alternate scores option. |
Submit the relevant assignment before doing the self review. | The composite score is displayed in the alternate scores view. | The student is able to see the composite score. |
