CSC/ECE 517 Fall 2018- Project E1858. Github metrics integration: Difference between revisions
| Line 50: | Line 50: | ||
===='''Use Case Diagram'''==== | ===='''Use Case Diagram'''==== | ||
[[File: | [[File:Usecase_1.2_Updated.png|none|frame|Use Case diagram of two approaches to append 'GitHub contribution metric' in teammate review. ]] | ||
[[File:Ssdtusecase323.png|none|frame|Use Case diagram explaining approach to add new column 'GitHub contribution metric' in 'View submission | [[File:Ssdtusecase323.png|none|frame|Use Case diagram explaining approach to add new column 'GitHub contribution metric' in 'View submission | ||
]] | ]] | ||
Revision as of 00:54, 8 December 2018
Introduction
Problem Statement
Expertiza provides Teammate Reviews under View Scores functionality for each assignment. Purpose of this project is to augment existing assignment submissions with data that can give a more realistic view of the work contribution of every team member using external tools like GitHub. This external data may include: number of commits, number of lines of code modified, number of lines added, number of lines deleted from each group’s submitted repository link from GitHub.
- 1. Teammate Reviews functionality in the View Scores page gauges teammate views on how much other team members contributed to the project. We need to augment this data with data from external tools like GitHub in order to validate that feedback. New metrics will be appended under each student data under the same functionality.
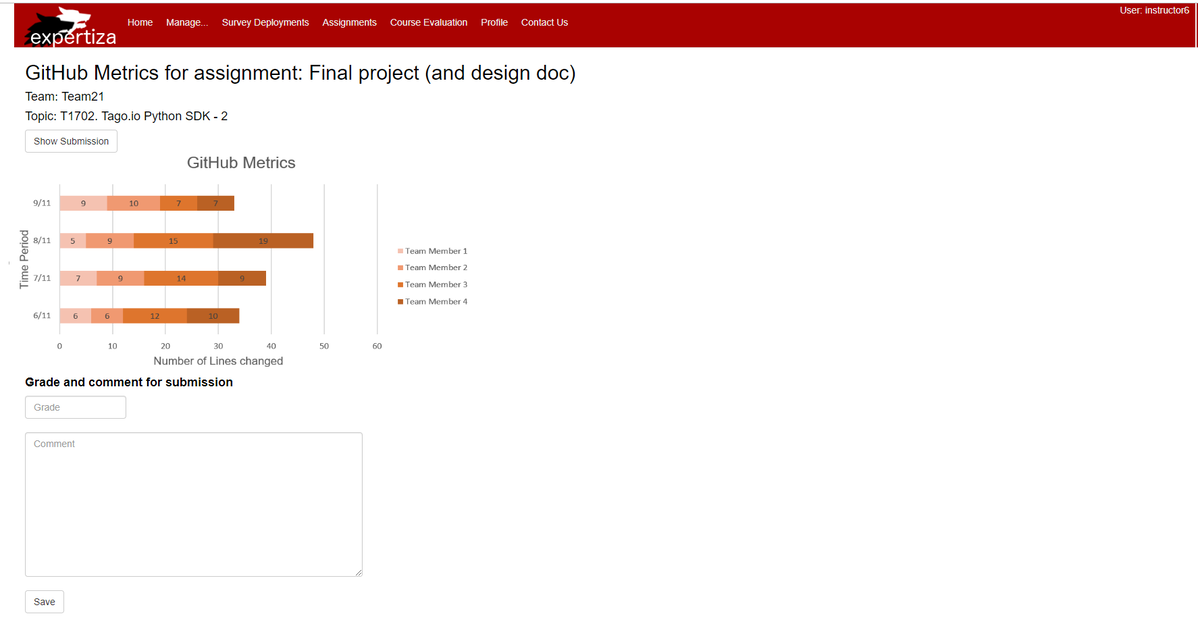
- 2. Github Metrics under View Submissions page should include a bar chart that shows number of commits by the team throughout the assignment timeline. This will help instructors to get a team overview, and aid grading process.
While this data will not have marks associated directly, it will prove useful to the instructor in differentiating the performance of team members and hence awarding marks as per contribution. Overall data for the team, like the number of committers and number of commits may also help instructors to predict which projects are likely to be merged.
Current Scenario

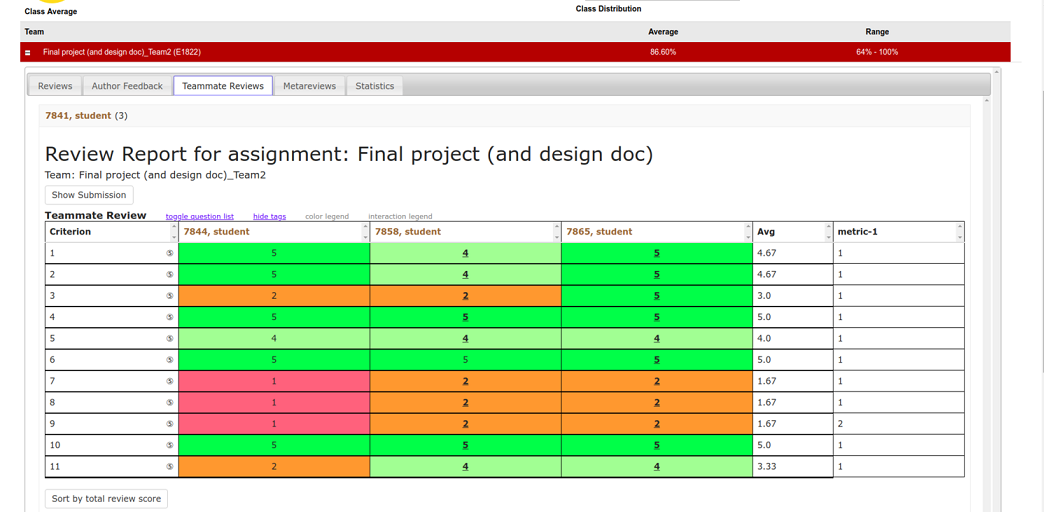
Checking commits performed by each team member on GitHub is a solution, but that is inefficient from instructor's/reviewer's perspective as there are many assignments, submissions, and tight deadlines.
Solution Design
- The Github metrics that need to be integrated with Expertiza were finalized as below. These metrics are captured on a per-user basis:
- Total number of commits.
- Number of files changed.
- Lines of Code added
- Lines of code modified.
- Lines of code deleted.
- Pull Request Status ( includes code climate and Travis CI Build status)
- User Github metrics:
- Committer ID
- Committer Name
- Committer email ID
- A new link "Github Metrics" is provided under “View Submissions” for an assignment in the instructor view.This link opens a new tab and shows a stacked bar chart for number of commits per user vs submission timeline from assignment creation date to the deadline.
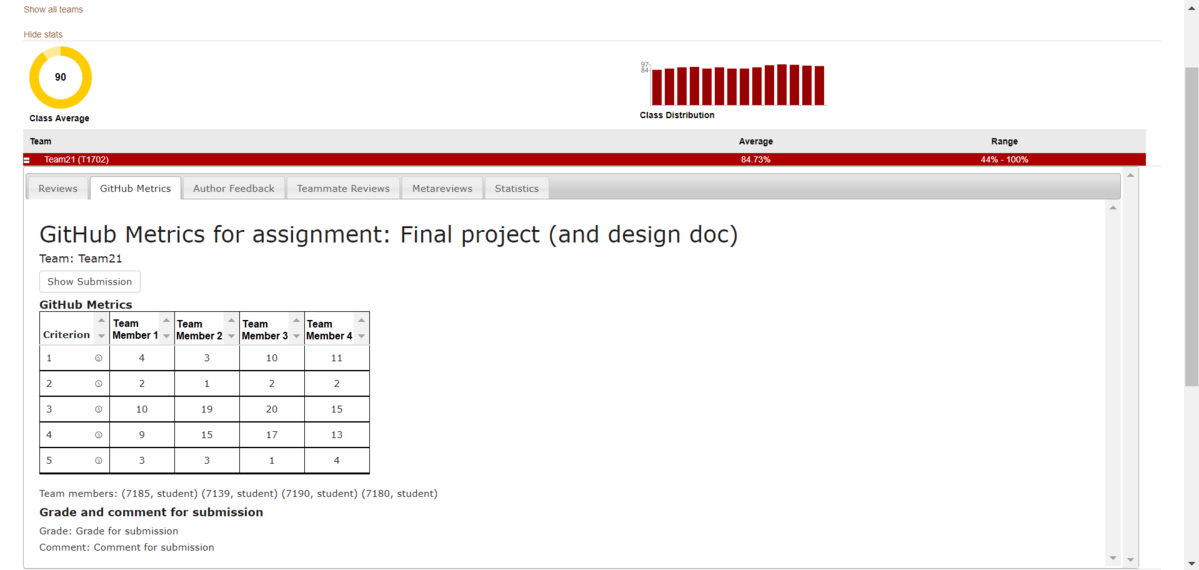
- In "View Scores" for an assignment in the instructor view, under Teammate Reviews tab, a new table for Github Metrics is added, which shows following Github metrics per user:
- Student Name/ID, Email ID, lines of code added, lines of code deleted, number of commits
- For GitHub integration, we have used GitHub GraphQL API v4. We have used OAuth gem for authentication purpose.
- We parse the link to PR and also have handled projects which do not have PR link, but just a link to the repository.
Use Case Diagram

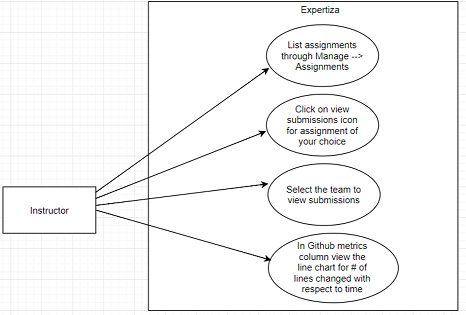
Use Case Diagram Details
Actors:
- Instructor: This actor is responsible for creating assignments and adding students to the assignment.
- Student: This actor is responsible for submitting, self-reviewing, and viewing the scores.
Database:
- The database where all the data of Expertiza is getting stored.
Pre Conditions:
- The Student should submit the assignment and self-review.
- The other students should submit the reviews of the work submitted.
Primary Sequence:
- The student should login.
- The student should browse and upload the assignment.
- The student should submit the assignment.
- The student should submit teammate-reviews.
Post Conditions:
- Instructor will be able to see the team contribution done by each team member in 'View Submissions' page using graph diagrams, as shown in the figure.
- Instructor will be able to see the work done by each student in 'Teammate Review Tab' with new metrics table appended at the end, as shown in the figure.
Design Principles
- MVC – The project is implemented in Ruby on Rails that uses MVC architecture. It separates an application’s data model, user interface, and control logic into three distinct components (model, view and controller, respectively). We intend to follow the same when implementing our end-point for pulling GitHub data.
- Dry Principle – We are trying to reuse the existing functionalities in Expertiza, thus avoiding code duplication. Whenever possible, code modification based on the existing classes, controllers, or tables will be done instead of creating the new one.
Design Detail
First Change
- We have finalized the approach for first change. We will add a new tab called "Github Metrics" in the View scores page and then show the metrics and results.
Second Change
- The second change is in the View Submissions page, where we intend to add a link "Github Metrics" to a new page that shows a lines of code chart per assignment team.
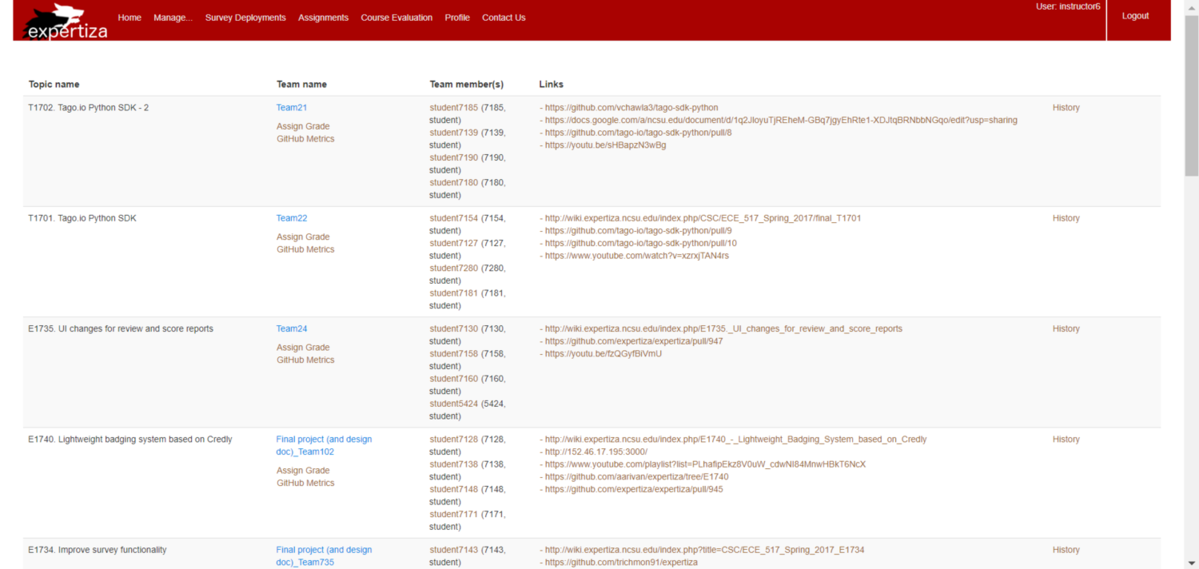
- The new page appears after clicking on the link "Github metrics", The bar chart portrays lines of code per team member for each day throughout the timeline.
Database Design
As of now, we do not have plans for database modifications. As number of commits and LOCs (lines of code) will keep of changing and stale data does not seem to be of significant benefit for analysis, we will be concentrating on latest state of project repositories.
Plan of action
- In line with our investigation, we will be using the official gem Octokit to get GitHub data from API. The idea is to always get the latest data from GitHub and show it to the user. For grading purposes, we will alternate a view between the latest data and data till submission deadlines.
- Unfortunately, GitHub only allows 60 public GET requests per hour and 5000 if authenticated. We thus intend to use omniauth-github gem to integrate GitHub OAuth to authenticate the instructor.
- There is ample documentation for GitHub API. The GitHub API returns JSON and we have been able to retrieve sample data using it.
- The "Teammate Review" section will get an additional table, in the View Scores page. We will be introducing our logic in the Grades controller (grades_controller.rb). A new function will be created that will use the Octokit functions to retrieve the required data for the entire team.
- Our new function will be called from the view action in the same controller. It will return the GitHub data which will be stored in an instance variable accessible to the views.
- We then implement the view. To show the GitHub metrics, we will be modifying the _teammate_reviews_tab.html.erb partial under grades view-folder. The instance variable will be accessible here and will be used to pass data to the table.
- For charting, we will use the bar-chart function in the grades controller, also used in a previous project- 1 2 3.
- The table will be shown below the actual "Teammate Review" table as per the requirements.
Test Plan
Subtask 1: GitHub metrics in teammate reviews
1) Log in as an instructor
2) Navigate to assignments through Manage --> Assignments
3) Select "View scores" icon for the assignment of your choice
4) Select the team for which you wish to view scores
5) Go to "GitHub metrics" tab
6) View data per team member based on different GitHub metrics (e.g. lines of code added/changed/removed etc.)
Subtask 2: Line chart for # of lines changed by the overall team
1) Log in as an instructor
2) Navigate to assignments through Manage --> Assignments
3) Select "View submissions" icon for the assignment of your choice
4) Click on the "Github metrics" link for the team whose metrics you wish to view
5) A new page opens and shows # of lines changed per team member since the start of the assignment
Change-log for Reviewers
This section will be removed in the final draft. It is just here for convenience of reviewers to know which sections were majorly updated from last review.
- Removed "View submission" changes as per updated requirements (by the Professor).
- Updated "Introduction" to explain how the Github data will affect grading.
- Updated "Design Considerations" with results of further investigation and our conclusions as to which approach we will exactly take.
- Updated "Plan of Action" section to include which files and functions will be exactly updated.
- Updated "Proposed Solution and test plan" section to include modified views after discussing with the mentor.