CSC/ECE 517 Fall 2012/ch2b 2w-1w65 am: Difference between revisions
| Line 85: | Line 85: | ||
---- | ---- | ||
<code>class | <code>class PostController < ApplicationController | ||
def new | def new | ||
debugger | debugger | ||
Revision as of 18:01, 18 November 2012
Introduction
This is a wiki article for the material presented in the Coursera SaaS video series, 3.13 Debugging by Dr. Armando Fox and Dr. David Patterson. We aim to cover all the material presented in the video with definitions and examples
Why debugging in Rails can be tricky?
- We are used to printing the error on the terminal in most applications(Example: STDERR). This may not be possible for a web application since its primary form of input and output is through HTTP requests and responses.
- Errors early in flow might manifest itself late.
Consider the following hierarchy seen in a Rails application:
URI -> Route -> Controller -> Model -> View -> Renderer
Here, something that goes wrong in the controller might not manifest itself until the renderer. The root cause of the error might have happened a long time ago.
- Errors can be hard to localize/reproduce if it affects only some users or routes.
There are several approaches that can be used for debugging based on the mode of operation, that is development mode or production mode:
Printing to terminal:This is useful for developers, when they are writing code they can print errors to the terminal and then examine them. We cannot use this approach in production mode.
Logging: This is a more general approach to debugging which can be used in both modes. The logged entries are permanent record of what the application is doing. The recorded errors are saved in a log file and can be referenced later.
Interactive Debugging: Using this tool you can stop the application in its tracks and inspect the state of the variables or other parameters to locate the error.
Here is a summary of the various approaches and the modes in which they can be used:
| Approach | Development | Production |
|---|---|---|
| Printing to Terminal | ✓ | |
| Logging | ✓ | ✓ |
| Interactive Debugging | ✓ |
RASP
RASP is an acronym which briefs the steps which a developer could follow if she were facing an error message. It stands for:
- Read the error message.
- Ask your colleague
- Search using Stack Overflow or any other search engine.
- Post on Stack Overflow or class forum
Reading the error message carefully is the first step in debugging. The error messages in Rails are incredibly detailed and it gives us a lot of information, reading it carefully can help us locate the file and line in which you are facing the error. But what if the line looks alright to you?
The next step is to ask a colleague an informed question. In case you are doing pair programming, this is a good step to take. The question has to be of the form "I am trying to do this and I expected to get this but I got this other thing instead of foo."
If the previous steps fail then searching using stack overflow or Google is next, especially if its an error which is particular to a version of gems or OS
In case you don't find a solution to your problem the final step is to get minimal but complete information which reproduces the error message which you are experiencing and post it.
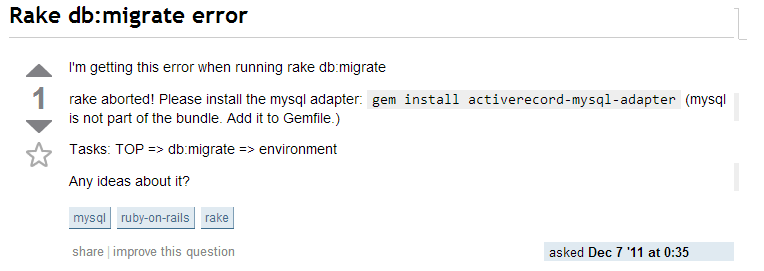
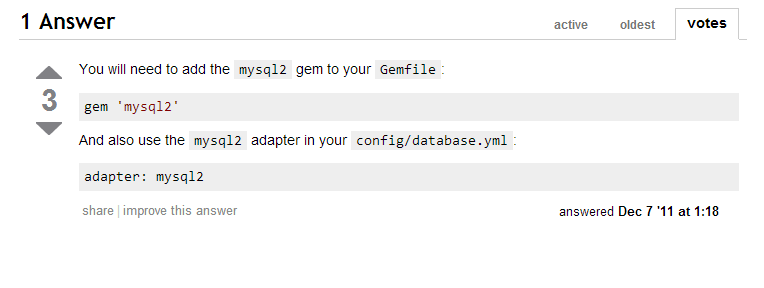
Here is an example question and solution from stack overflow:

As we can see the question follows the guidelines explained above. It gives minimal but complete information about the error. It does not give the entire description of the error. It is important to post minimal information so that the person who answers the question can understand your problem quickly.

The answer is posted within an hour of posting the question. This shows that posting on stack overflow is a fast way of getting expert help with debugging.
Understanding Error Messages in Rails
Application Trace
Full Trace
Framework Trace
Env Dump and Session Dump
Most Common Error Messages in Ruby
Rails Debugger
What is a debugger?
Sometimes printing errors to the console or logging is not enough to find out the root cause behind an error message. It is during these times when the debugger is a developer's best friend. The debugger helps us to step forward or backward in the code, execute or skip lines of code, examine the state of a variable or a parameter which has been passed. This will help the developer pinpoint to the actual source of the problem and fix it.
How to install the debugger?
In Rails, ruby-debug is a gem. We can install it like any other gem. To use the gem in a Rails application we need to add the following line:
require "ruby-debug"
in the config/environments/development.rb file.
In Ruby 1.9, you can use this command to install a compatible version of the debugger gem:
gem install debugger
Running the debugger
To use the debugger in the rails application we need to start the server with the --debugger option.
$ rails server --debugger
If we don't do this we would encounter an error like this:
***** Debugger requested, but was not available: Start server with --debugger to enable *****
We can invoke the debugger from any method by using the debugger keyword in the method.
Example:
class PostController < ApplicationController
 def new
   debugger
   @post = Post.new
 end
end
Once the debugger method is called a debugger shell is started inside the terminal window where the application server was launched, and the cursor will be placed at ruby-debug’s prompt (rdb:n) where n is the thread number. The prompt will show the next line of code which is waiting to run.
Conclusion
Further Reading
- Rails Guide - Debugging Rails Applications
- Debug your rails app with ruby-debug
- Ruby Forge - Documentation for ruby-debug