CSC/ECE 517 Fall 2013/ch1 1w11 sv: Difference between revisions
| Line 33: | Line 33: | ||
=== JavaScript Debugging === | === JavaScript Debugging === | ||
Firebug can be used to debug JavaScript code using the Console and Script Panel provided by this tool. These panels allow you to step-debug your code, profile performance, log errors and information and other useful functionality. | |||
=== Network Performance Analysis === | === Network Performance Analysis === | ||
Revision as of 22:17, 16 September 2013
Debugging Using Firebug
Firebug is a tool that enables web developers to debug, edit and inspect websites' components like CSS, HTML, DOM, JavaScripts. Firebug is free and open source software distributed under the BSD License.
Apart from providing debugging, Firebug is also used to analyse performance of websites.
Installation and Activation
Firebug can be installed as a Add-On/Plugin for Firefox. Firebug compatibility for different version of Firefox can be looked here.
Version for other browsers is under development.
Following are the ways to activate Firebug
- Click F12 => Activates Firebug on same window as a bar at the bottom.
- Click Ctrl+F12 => Activates Firebug on a separate window
- Right click on the webpage and click on "Inspect Element with Firebug".
Panel Description
Debugging
Firebug provide different tabs to examine HTML(Markup), CSS(Styling), DOM(Object Model, Scripts, Net (Network Analysis) etc
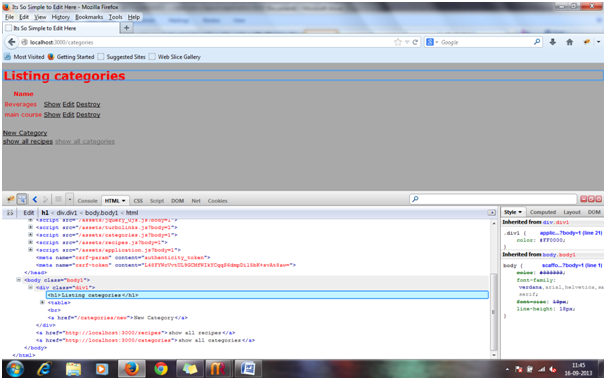
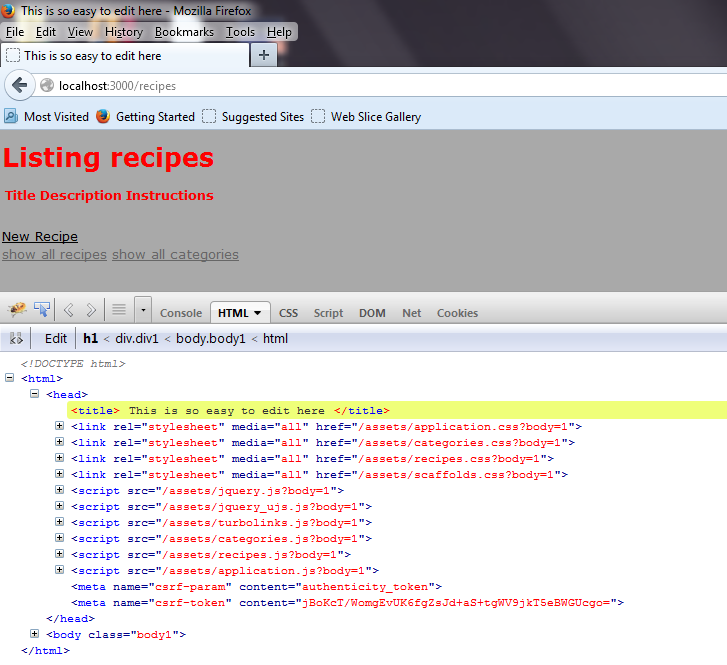
HTML Debugging
Firebug can point any HTML element with precision. HTML elements' attributes and text can be created, deleted, or edited just by clicking them. The changes will be reflected immediately as one type.
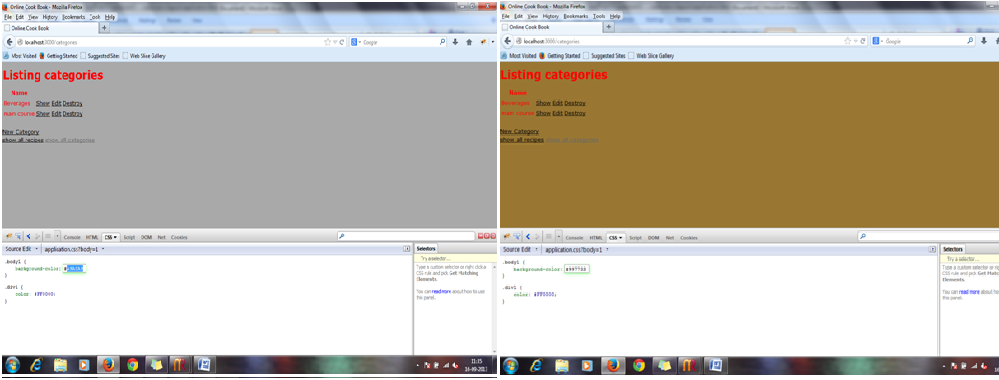
CSS Debugging
Firebug shows the styles that cascade together for each element. Rules are viewed in the order of precedence. The overridden properties are struck out. The style of any html element can be tweaked and checked in real-time. This tools is of great help to web/css designers. While editing a CSS property, the up and down arrow keys can be used to see all possible properties in alphabetical order. Firebug has the complete dictionary of standard CSS keywords in its memory
JavaScript Debugging
Firebug can be used to debug JavaScript code using the Console and Script Panel provided by this tool. These panels allow you to step-debug your code, profile performance, log errors and information and other useful functionality.
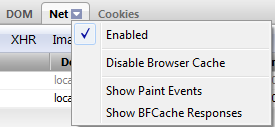
Network Performance Analysis
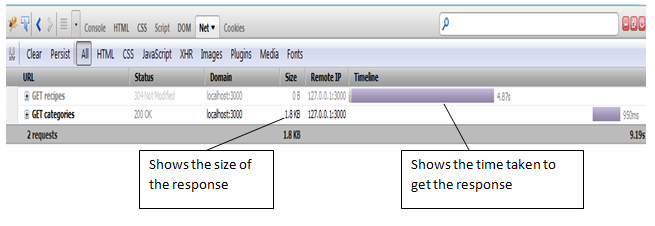
To view the net panel, enable the panel using net' tab menu
This panel shows the network performance of each request and also the time taken by the response. Net tab shows when the file started and stopped loading relative to all the other files. This helps to tune the order of files to show up in the page, so that the users don't have to wait for the important information to be displayed.
