CSC/ECE 517 Fall 2019 - E1979. Completion/Progress view: Difference between revisions
Jump to navigation
Jump to search
| Line 26: | Line 26: | ||
* As the description of our object, the average ratings part of this project has been done last year. And they add a new column (author feedback) to review report. But their functions still have some drawbacks. So we also need to improve the several functions of author feedback. | * As the description of our object, the average ratings part of this project has been done last year. And they add a new column (author feedback) to review report. But their functions still have some drawbacks. So we also need to improve the several functions of author feedback. | ||
# Use the exist code to calculate the average score of feedback | # Use the exist code to calculate the average score of feedback | ||
# Make the author feedback column | # Make the author feedback column adjust to existing view. | ||
* So here is our plan and solutions to finish this project. | * So here is our plan and solutions to finish this project. | ||
Revision as of 18:28, 6 December 2019
Introduction
- In Expertiza, peer reviews are used as a metric to evaluate someone’s project. Once someone has peer reviewed a project, the authors of the project can also provide feedback for this review, called “author feedback.” While grading peer reviews, it would be nice for the instructors to include the author feedback, since it shows how helpful the peer review actually was to the author of the project.
Current Implementation
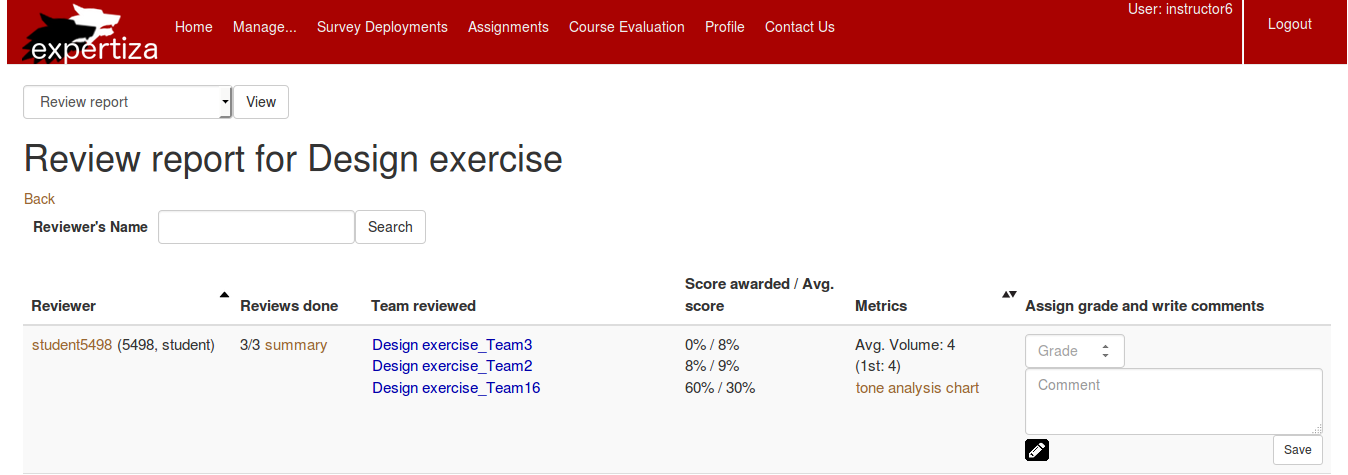
- Currently, the instructor can only see several information, including numbers of review done, team the student which have reviewed, about author feedback. The current view report can be shown as below.
- However, the instructor has no easy way of seeing the author-feedback scores, so it would be far too much trouble to include them in grades for reviewing.
- So the aim of this project is to build more feedback information into the reviewer report. So that the instructor of the course is able to grade reviewers based on author feedback and review data.
Problem Statement
- We need to implement the integration of review performance which includes:
- # of reviews completed
- Length of reviews
- [Summary of reviews]
- Whether reviewers added a file or link to their review
- The average ratings they received from the authors
- An interactive visualization or table that showed this would be GREAT (We may use “HighChart” javascript library to do it.)
- After analysis the current code, we found that the number of reviews, summary of reviews have already existed in the system. So we only need to finished the following tasks.
- Length of reviews (we can use HighChart to realize visualization)
- Whether reviewers added a file or link to their review
- The average ratings they received from the authors
- As the description of our object, the average ratings part of this project has been done last year. And they add a new column (author feedback) to review report. But their functions still have some drawbacks. So we also need to improve the several functions of author feedback.
- Use the exist code to calculate the average score of feedback
- Make the author feedback column adjust to existing view.
- So here is our plan and solutions to finish this project.
Project Design
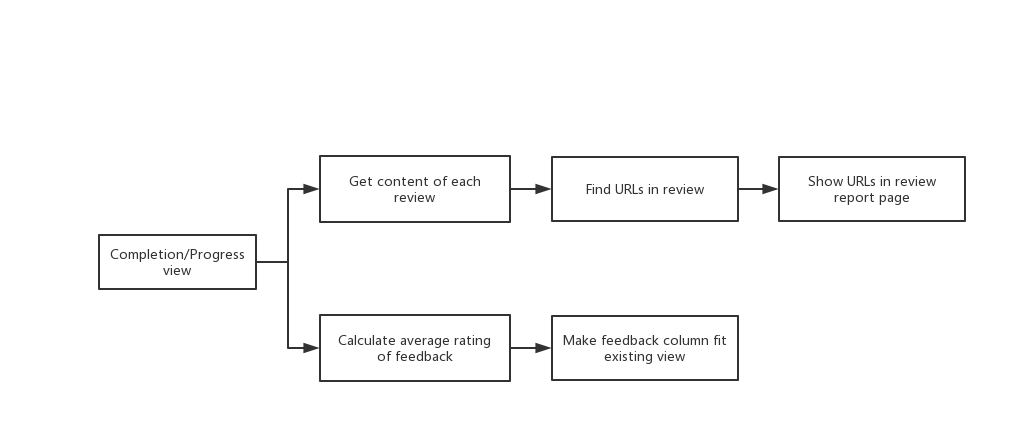
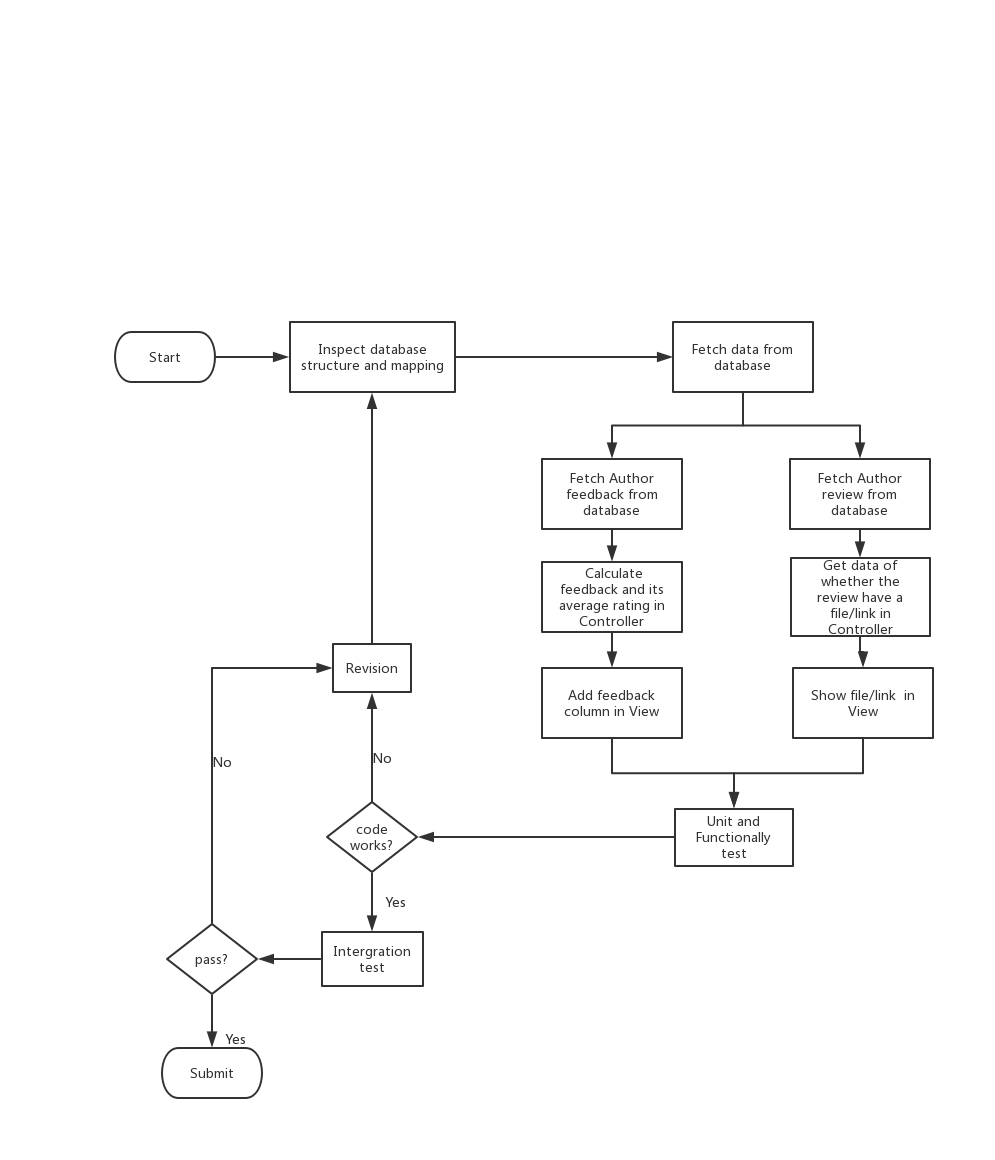
The basic design of this project can be shown in the UML flow chart below.
View Improvement
- We decide mainly change the page of "Review report" (Log in as an instructor then go to Manage -> Assignments -> View review report.) from three aspects.
- We are planning to add one more column to show the average ratings for feedback for a student's review of a particular assignment. The logic for calculating the average score for the metareviews would be similar to already implemented logic for the "Score Awarded/Average Score" column.
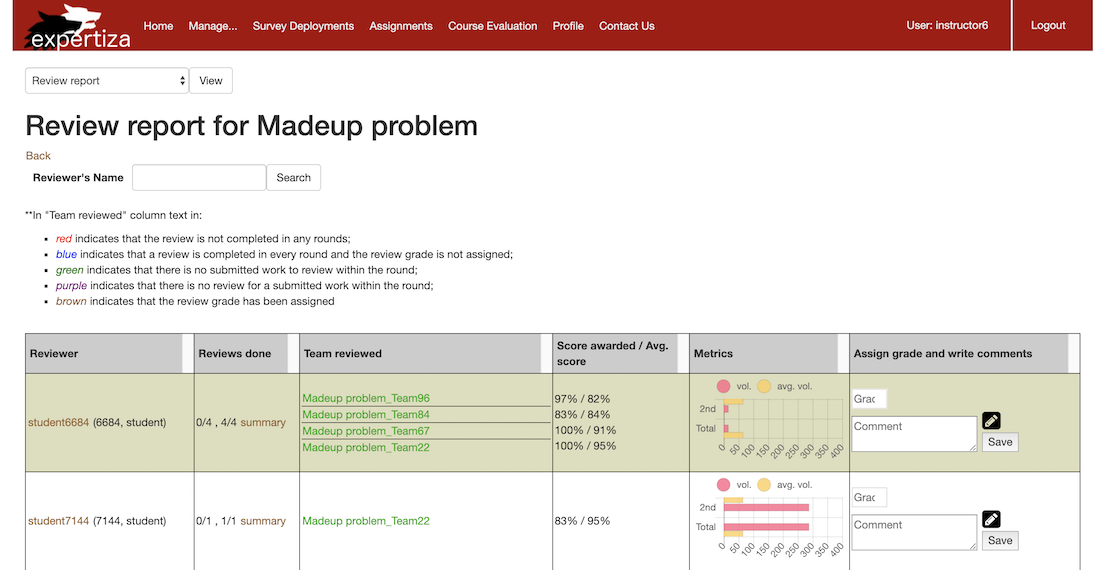
- We are planning to improve the column of review length. Now it is just bare data and average data. We will make the review length into visualized chart by using “HighChart” javascript library. So that length of review will become more clear for instructors. The chart will be shown like below.
- We are planning to add all links which attached to their reviews below Team name. If there are links in the review, the links will be shown below.
Controller Improvement
The Controller design is based on the data we need for view. We change following method.
- calcutate_average_author_feedback_score
- list_url_in_comments
Code Changes
Here is the file we have changed.
- _review_report.html.erb
- review_mapping_helper.rb
- review_mapping_helper_spec.rb
Test Plan
We will use unit test and functionally test with Rspec, and integration test by using TravisCI and Coveralls bot.
Automated Testing Using Rspec
- We plan to test the response report page (/review_mapping/response_report?id={:assignmentID}) to make sure the new field (feedback, file and chart) exists.
- We will add a Rspec test in each controller which tests our new methods, such as have_file_added and have_link_added.
Coverage
The coverage of Coveralls bot will be filled after our finish all our work.
Manual UI Testing
- Log in as an instructor
- Click Manage and choose Assignments
- Choose review report and click view
- See whether new fields are shown.
Team Information
Mentor: Mohit Jain
- Mentor: Mohit Jain ()
- Jing Cai ()
- Yongjian Zhu ()
- Weiran Fu ()
- Dongyuan Wang ()


