CSC/ECE 517 Fall 2014/ch1a 26 sn
Debugging in Rails using Pry
Debugging is a process of finding and reducing the bugs or defects in a computer program thereby making it behave as expected. Few of the debugging techniques are Print debugging (also known as printf debugging), Log debugging and Interactive debugging<ref>http://rubylearning.com/satishtalim/ruby_logging.html</ref><ref>http://object.io/site/2011/getting-to-know-ruby-debugger/</ref>. Rails provides a range of options to make debugging<ref>http://en.wikipedia.org/wiki/Debugging</ref> easier which include debug helpers, loggers, graphical debuggers, Pry, and so on<ref>http://guides.rubyonrails.org/debugging_rails_applications.html</ref>. In the following sections, debugging in rails using PRY is being explained.
Introduction to Pry debugger
- Pry is an interactive shell for the Ruby programming language. Pry could be started at any point within a running program. Due to this, programmers can inspect the program, correct the source code, or change its current state without having to restart the process. Pry is thus notable for its ability to start a REPL within a running program.
- Pry has many features that make it extremely efficient to use. One of the example here could be Pry's hist --grep that makes it easy to search through your Pry history. Also, Pry uses the filesystem metaphor for exposing most of its introspective capabilities such as the ls command to list the methods and variables and the cd command to start interacting with a particular object.
- To start a debugging session, the require 'pry' and binding.pry lines need to be included in the program that needs to be debugged. The line binding.pry could be inserted at any point in your program. Whenever the Ruby interpreter executes this line, it opens a Pry REPL session. The code after the binding.pry statement is not executed unless instructed by the programmer. Changes could be made to fix the code and then return to running program from same point.
Installation
- To use Pry for debugging a Rails application, you first need to download and install Pry-debugger. If you are using Ruby version 2.0 or higher, then download pry-debugger from here. If you are using Ruby version 1.9 or lower, then download pry-debugger from here.
- To install the debugger use the following command:<ref>http://pryrepl.org/</ref>
gem install pry-debugger.gem
- Include the following line of code on the gem file:
gem 'pry-rails', :group => :development
- Once that is done, the necessary dependencies could be installed using the following command:
$bundle install
Execution Commands
- To use the execution command, invoke pry normally. There is no need to start your script or application differently. For the sake of clarity in explanation, we would refer to the program below:
require 'pry'
def method1 (seller)
	puts 'Inside method 1'
	method2(seller)
  end

def method2(seller)
  binding.pry      	# Execution will stop here.
  new_products = method3(seller)
  puts 'After calling method3'
end

def method3(seller)
	puts 'Inside method 3'
	puts 'Continuing in method 3'
end

method1('xyz')
The Step command:
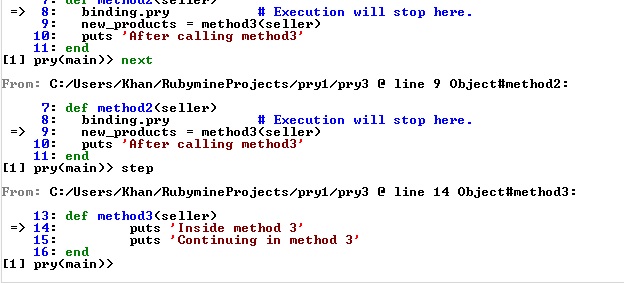
- The step command continues execution by moving into the method on the next line. To put it in another way, the command takes us deeper into the method. Following our example, the step command would take us into method3 at which point we would be asked what to do next. The following screenshot demonstrates our example:
The Next command:
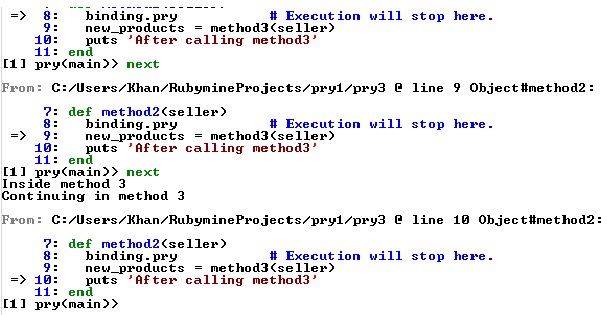
- The next command runs the current line and moves to the next line in the current context. If the next line in the code is a method call, then unlike the step method the execution does not go deeper into the method. Following our example, if we execute the above code, the execution stop at the binding.pry line and the debugger asks us for the further action. On using the next command, the execution moves to the next line that is new_products = method3(seller) without going deeper into the method. The debugger now waits for another instruction from the programmer and if the command is next again, the debugger simply goes to the next line of code after executing the method. Thus, all the code within the method3 method (which would otherwise be many steps), has been concluded with a single use of the next command. The example could be seen in the following screenshot:
The Finish command:
- Now once we have stepped into a method using the step command, the debugger would ask us what needs to be done next. Now if we want to jump to the end of the method without the debugger asking us our choice of navigation command at the end of each line, we could use the finish command. The finish command would execute the code in the method and return back to the point from where the method was called. In our example, while the debugger is in method3, the finish command would complete the code execution in method3 and return back to method2.
The Continue command:
- With this command we can abandon the pry session and continue the normal execution of the program. If the interpreter encounters another binding.pry, a pry session is again opened. This can be incredibly annoying, since our program will stop and we’ll have to navigate the debugger every single time, so we’ll probably want to type exit-program to cancel the effect of any following binding.pry statements, thereby exiting our rails application.
Breakpoints:
- You could set or change the breakpoints in a program directly using Pry. The break command is used for this purpose. You could set breakpoints in the current file, or in any other file, or a method. Conditional breakpoints could also be changed or set using optional expressions.
- Command to display the list of breakpoints and conditional breakpoints:
break --condition 4 x > 2      Change condition on breakpoint #4 to 'x > 2'.
break --condition 6            Remove the condition on breakpoint #6.
break                          List all breakpoints. (Same as `breakpoints`)
break --show 2                 Show details about breakpoint #2.
- Setting breakpoints:
break 5                        Break at line 5 in the current file.
break <class_name>#run         Break at the start of `<class_name>#run`.
break app/models/test.rb:4     Break at line 4 in test.rb.
- Deleting breakpoints:
break --delete 5               Delete breakpoint #5.
break --disable-all            Disable all breakpoints.
The Edit command:
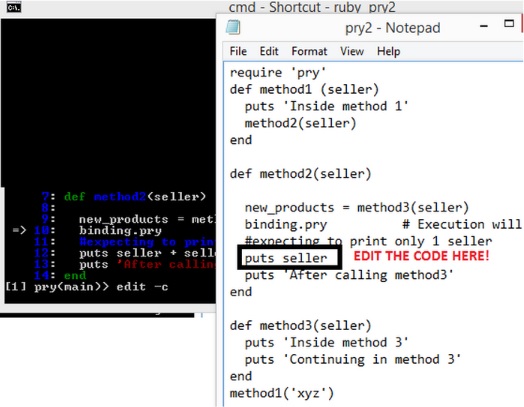
- You could edit the code in a file by just switching to the editor rather than having to end the Pry session. This could be done using the edit command<ref>http://kgrz.io/pry/2014/02/07/Prys-edit-command.html</ref>. On using the edit command, a new editor window pops up thereby enabling the programmer to edit the code. However, you need to specify the type of editor in the .pryrc file. For example, in order to edit the code using a Notepad editor, you need to specify the following in the .pryrc file:
Pry.config.editor = 'Notepad'
View the documentation or source for a method:
- You sometimes would want to know how a particular method works or what kind of arguments it takes. The show-doc method could help you determine that. Also, you would want to know the source of the method. This could be done using the show-method command.
pry(main)> def foo
pry(main)*   puts "Welcome to the foo!!"
pry(main)* end
=> nil
pry(main)> show-method foo

From: (pry) @ line 3:
Number of lines: 3
Owner: Object
Visibility: private

def foo
  puts "Welcome to the foo!!"
end
List of other commonly used commands:
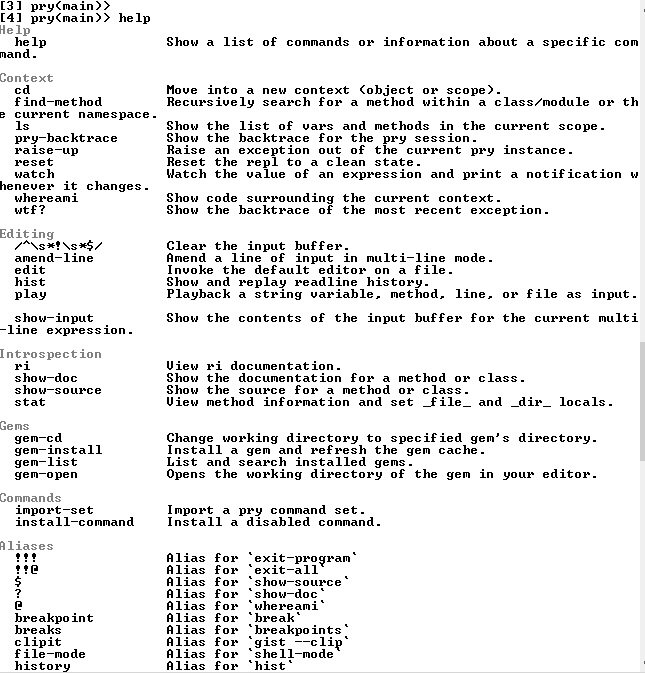
- The other list of commands could be found by typing help<ref>https://github.com/pry/pry/wiki/Command-system#Help_command</ref>. The following shows other list of commands:
- Interested people can learn more about using Pry as a debugger by watching the video tutorial.
Remote Debugging<ref>http://wiki.freepascal.org/Remote_Debugging</ref>
- So far, Pry has been a good tool to digging into the code and checking how the code is actually working and what is exactly going on inside the code. We used binding.pry inside the program where the execution stops and the user is asked to give further instructions. However, there are situations where the execution of the program would not stop and the would not allow you to inspect the code especially in situations when Foreman is used to manage processes. In such situation, pry-remote could be of help.
- When a process that is being run by Foreman comes across binding.pry, it would halt but a Pry session would not be opened. You would be forced to kill the process as the application actually freezes. Thus, in such cases pry-remote would be a great solution and in order to work around with this, you need to first install the gem:
gem install pry-remote
- Then run bundler:
bundle install
- Once you have installed pry-remote, a breakpoint can be added using binding.remote_pry anywhere in the program from where the code needs to be debugged.
def index
    binding.remote_pry
    ...
  end
end
- Pry-remote would block your program when it hits the binding.remote_pry and open a Drb endpoint that a client can connect to<ref>http://www.ruby-doc.org/stdlib-1.9.3/libdoc/drb/rdoc/DRb.html</ref>. Running pry-remote in a shell will then connect to the session. You would then be able to interact with Pry as you would normally do. You could unblock the program by using exit.
Comparison with other debugging tools
Pry is a replacement for Ruby's default REPL,irb. It has many more additional features as compared to irb. Some of the features that provide Pry an edge over the other debugging tools are as follows:
- Pry enables code or syntax highlighting, auto identation and a runtime debugging console.
- It has the ability to load any portion of the file in your text editor directly into the REPL session.
Other Debuggers available in the market are:
- JetBrains RubyMine Commercial but very easy to use windows based debugger. It supports Ruby versions from 1.8.6 to 2.1.
- Komodo Commercial IDE used for Ruby and other languages like Perl and java. It has graphical debugger and supports multi-process debugging.
- Chrome Dev-tools The elements tab is used to debug and get rapid feedback about experimental design changes in HTML or CSS.
- Memcached In production environment this tool can be used in addition with Heroku to access detailed stats about Memcached usage to find if you have high hit rate or low eviction rate.
- Operating System Tools Mostly a mixture of commands used to debug only specific errors for example, Curl to debug URL's or G Debugger to debug infinite loops.
Reference
<references />


